参数引导:估计 MSE
统计学问题:级别(k\)修剪后的平均值的MSE是多少?
我们如何回答它:估计从标准柯西分布(t 分布 w/df = 1)生成的大小为 20 的随机样本的水平 \(k\) 修剪均值的 MSE。
背景
Bootstrap自助抽样法是一种重要的统计推断方法,由Efron在1977年首次提出。它利用有放回的重抽样技术,能够估计任何样本统计量的分布,常用于寻找:
-
统计量的标准误差
-
未知参数的置信区间
-
假设检验的p值
原理
Bootstrap的基本思想是,从样本中重抽样并用重抽样数据来推断样本,来对用样本数据推断总体建模。
假设有一个分布的候选集合P,其中P0描述了观测数据的真实状态,无论是标准误差、置信区间或者p值,都可以表示成P0的函数Q(P0)。Bootstrap的目的是寻找P0的近似分布P1,得到Q(P0)的估计Q(P1)。假若候选集合P由一个有限维的参数θ索引,则称为参数化bootstrap,反之则为非参bootstrap。
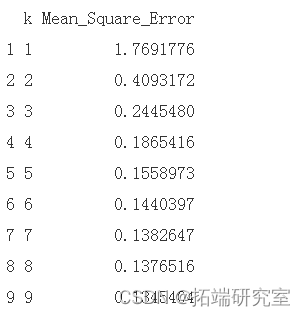
目标参数 \(\theta\) 是中心或中位数。柯西分布不存在均值。在表中总结 MSE 的估计值 \(k = 1, 2, … 9\)。
result=rep(0,9)

for(j in 1:9){

  n<-20


  for(i in 1:m){

    x<-sort(rcauchy(n))
参数自抽样法:经验功效计算
统计问题:随着零假设与现实之间的差异发生变化,功效如何变化?
我们如何回答:绘制 t 检验的经验功效曲线。
可下载资源
t 检验的原假设是 。另一种选择是。
您将从具有 的正态分布总体中抽取大小为 20 的样本。您将使用 0.05 的显着性水平。
显示当总体的实际平均值从 350 变为 650(增量为 10)时,功效如何变化。
y 轴是经验功效(通过 bootstrap 估计),x 轴是 \(\mu\) 的不同值(350、360、370 … 650)。
    x <- rnorm(n, mean = muA, sd = sigma) #抽取平均值=450的样本

    ts <- t.test(x, mu = mu0) #对无效的mu=500进行t检验

    ts$p.value
参数自抽样法:经验功效计算
统计问题:样本量如何影响功效?
我们如何回答:创建更多的功效曲线,因为实际均值在 350 到 650 之间变化,但使用大小为 n = 10、n = 20、n = 30、n = 40 和 n = 50 的样本生成它们。同一图上的所有 5 条功效曲线。

pvals <- replicate(m, pvalue())

power <- mean(pvals <= 0.05)


points(sequence,final2[2,],col="red",pch=1)


points(sequence,final2[3,],col="blue",pch=2)
随时关注您喜欢的主题
参数自抽样法:经验置信水平
统计问题:在制作 95% CI 时,如果我们的样本很小并且不是来自正态分布,我们是否仍有 95% 的置信度?
我们如何回答它:根据样本为总体的平均值创建一堆置信区间 (95%)。
您的样本大小应为 16,取自具有 2 个自由度的卡方分布。
找出未能捕捉总体真实均值的置信区间的比例。(提醒:自由度为 \(k\) 的卡方分布的平均值为 \(k\)。)
for(i in 1:m){

  samp=rchisq(n,df=2)

  mean=mean(samp)

  sd=sd(samp)

  upper=mean+qt(0.975,df=15)*sd/4

非参数自抽样法置信区间
统计问题:基于一个样本,我们可以为总体相关性创建一个置信区间吗?
我们如何回答:为相关统计量创建一个 bootstrap t 置信区间估计。
boot.ti <-

  function(x, B = 500, R = 100, level = .95, stattic){


    x <- as.matrix(x)


library(boot)       #for boot and boot.ci


data(law, package = "bootstrap")


dat <- law


ci <- boot.t.ci(dat, statistic = stat, B=2000, R=200)

ci
自抽样法后的Jackknife
统计问题:R 的标准误差的 bootstrap 估计的标准误差是多少?
我们如何回答它: data(law) 像上一个问题一样使用。在 bootstrap 后执行 Jackknife 以获得标准误差估计的标准误差估计。(bootstrap 用于获得总体中 R 的 SE 的估计值。然后使用折刀法获得该 SE 估计值的 SE。)
indices <- matrix(0, nrow = B, ncol = n)


# 进行自举

for(b in 1:B){

    i <- sample(1:n, size = n, replace = TRUE)

    LSAT <- law$LSAT[i]


#  jackknife


for(i in 1:n){

    keepers <- function(k){

         !any(k == i)

    }

自测题
Submit the rendered HTML file. Make sure all requested output (tables, graphs, etc.) appear in your document when you submit.
Parametric Bootstrap: Estimate MSE
Statistical question: What is the MSE of a level \(k\) trimmed mean?
How we can answer it: Estimate the MSE of the level \(k\) trimmed mean for random samples of size 20 generated from a standard Cauchy distribution (t-distribution w/df = 1). The target parameter \(\theta\) is the center or median. The mean does not exist for a Cauchy distribution. Summarize the estimates of MSE in a table for \(k = 1, 2, … 9\).
Parametric Bootstrap: Empirical Power Calculations
Statistical question: How does power change as the difference between the null hypothes and the reality changes?
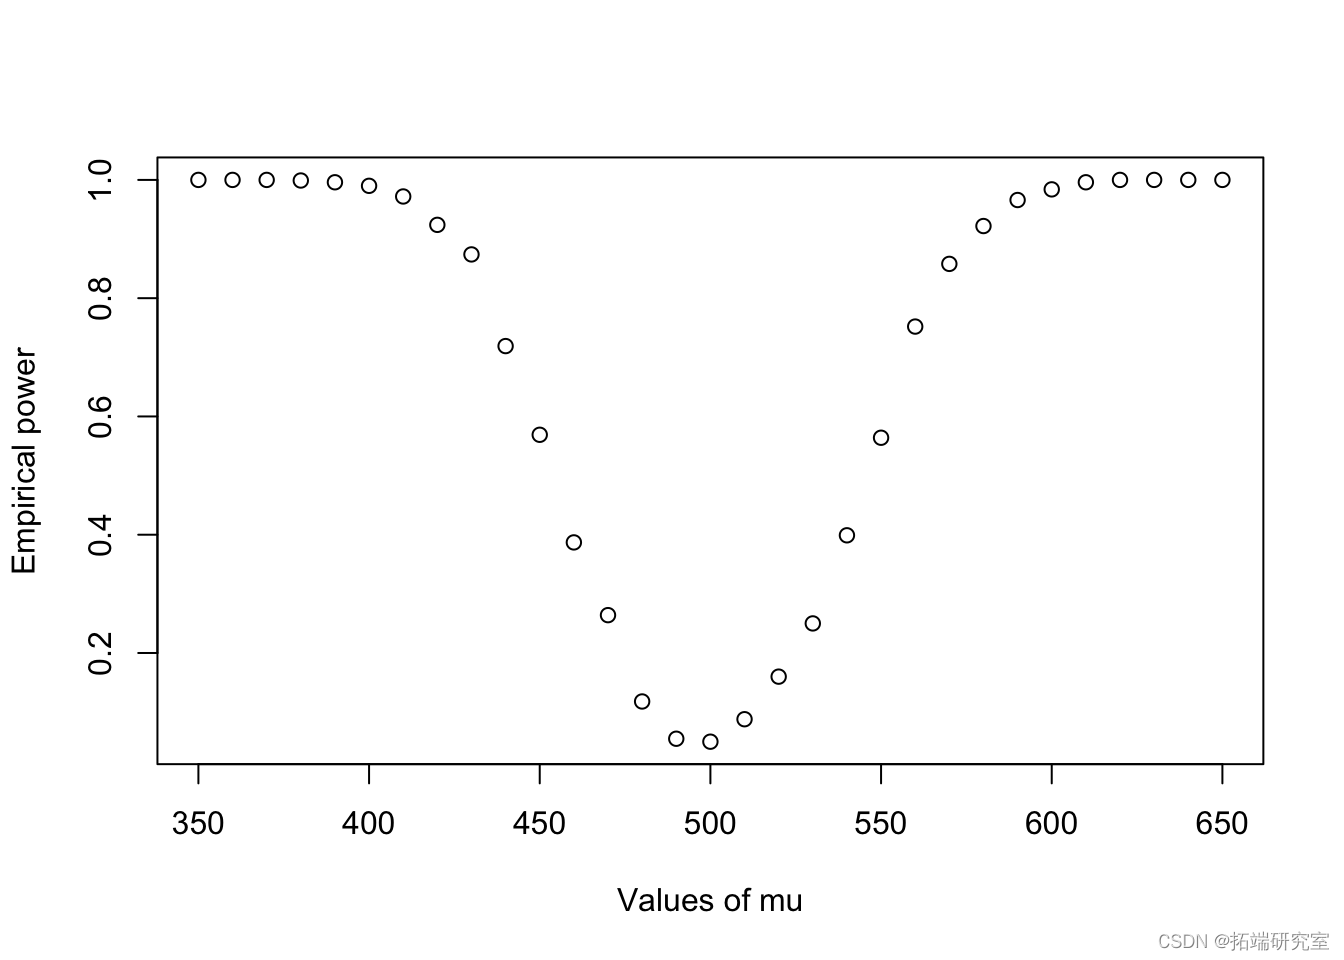
How we can answer it: Plot an empirical power curve for a t-test.
The null hypothesis of the t-test is \(\mu = 500\). The alternative is \(\mu \ne 500\).
You will draw samples of size 20, from a normally distributed population with \(\sigma = 100\). You will use a significance level of 0.05.
Show how the power changes as the actual mean of the population changes from 350 to 650 (increments of 10).
On the y-axis will be the empirical power (estimated via bootstrap) and the x-axis will be the different values of \(\mu\) (350, 360, 370 … 650).
Parametric Bootstrap: Empirical Power Calculations
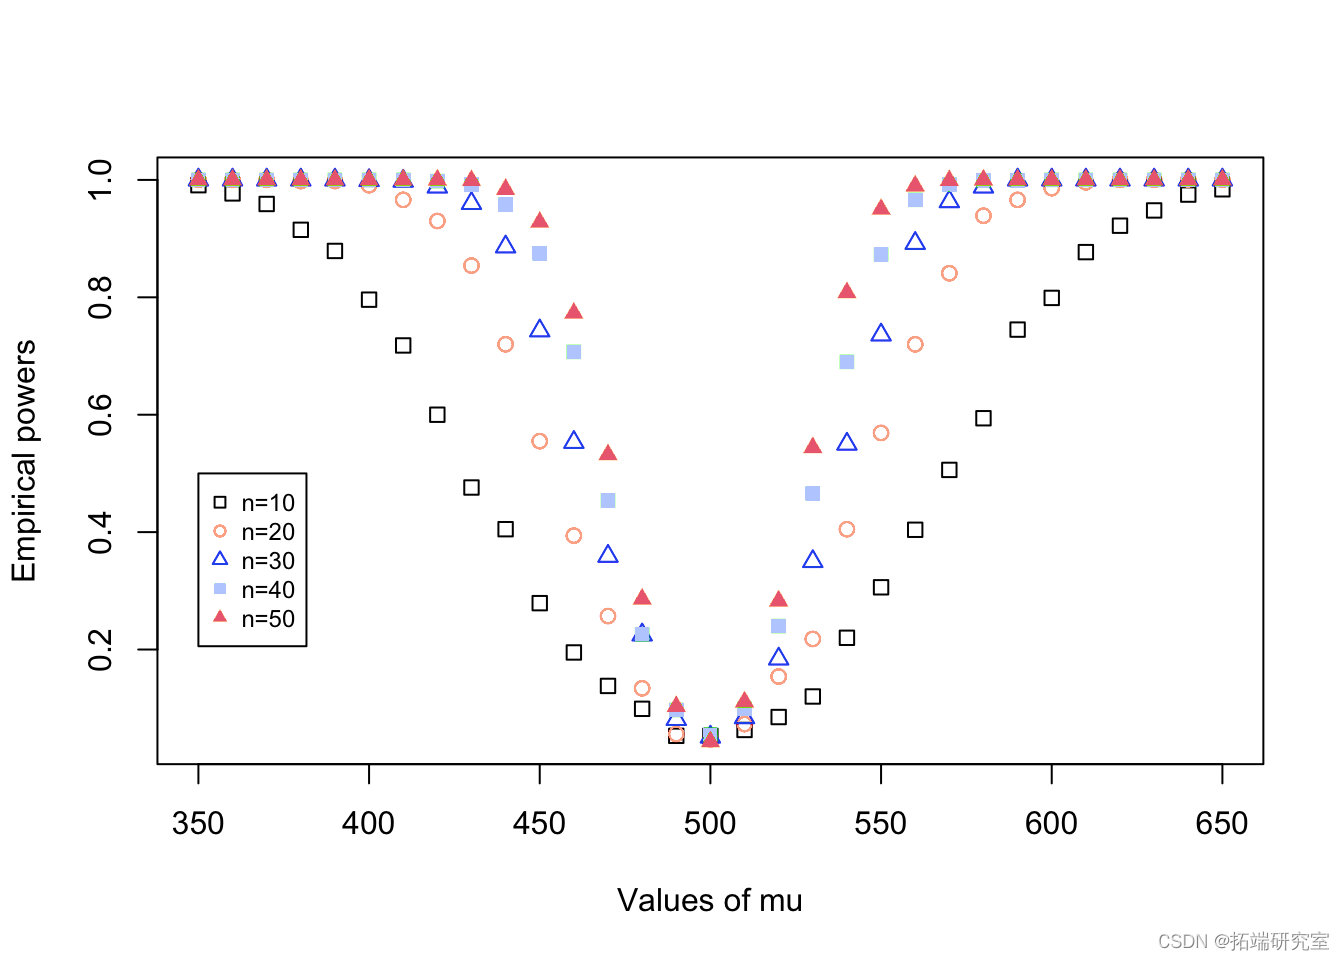
Statistical question: How does sample size affect power?
How we can answer it: Create more power curves as the actual mean varies from 350 to 650, but produce them for using samples of size n = 10, n = 20, n = 30, n = 40, and n = 50. Put all 5 power curves on the same plot.
Parametric Bootstrap: Empirical Confidence Level
Statistical question: When making a 95% CI, are we still 95% confident if our samples are small and do not come from a normal distribution?
How we can answer it: Create a bunch of Confidence Intervals (95%) for the mean of a population based on a sample.
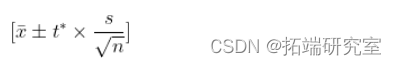
\[\bar{x} \pm t^{*} \times \frac{s}{\sqrt{n}}\]
Your samples should be of size 16, drawn from a chi-squared distribution with 2 degrees of freedom.
Find the proportion of Confidence Intervals that fail to capture the true mean of the population. (Reminder: a chi-squared distribution with \(k\) degrees of freedom has a mean of \(k\).)
Non Parametric Bootstrap Confidence Interval
Statistical question: Based on one sample, can we create a confidence interval for the correlation of the population?
How we can answer it: Create a bootstrap t confidence interval estimate for the correlation statistic.
Jackknife after bootstrap
Statistical question: What is the standard error of the bootstrap estimate of the standard error of R?
How we can answer it: Use data(law) like the previous problem. Perform Jackknife after bootstrap to get a standard error estimate of the standard error estimate. (The bootstrap is used to get an estimate of the SE of R in the population. The jackknife is then used to get an SE of that SE estimate.)
可下载资源
关于作者
Kaizong Ye是拓端研究室(TRL)的研究员。在此对他对本文所作的贡献表示诚挚感谢,他在上海财经大学完成了统计学专业的硕士学位,专注人工智能领域。擅长Python.Matlab仿真、视觉处理、神经网络、数据分析。
本文借鉴了作者最近为《R语言数据分析挖掘必知必会 》课堂做的准备。
非常感谢您阅读本文,如需帮助请联系我们!
 视频讲解|Stata和R语言自助法Bootstrap结合GARCH对sp500收益率数据分析
 Python机器学习算法KNN、MLP、NB、LR助力油气钻井大数据提速参数优选及模型构建研究
 【视频讲解】非参数重采样bootstrap的逻辑回归Logistic应用及模型差异Python实现

