
Developing a Hybrid Enhanced Dual Detection Engine Combining iForest, XGBoost, and Autoencoder to Implement Metro Network Traffic Data Security Monitoring
Metro network traffic has grown exponentially in recent years. Traditional single-point cloud monitoring faces three major bottlenecks: detection lag, uneven computing power, and weak visualization. This paper proposes a three-tier “edge sensing – cloud decision – collaborative self-healing” architecture that combines millisecond-level lightweight handling with near-real-time deep decision-making, achieving over 90% attack detection accuracy and a 92.3% blocking rate.

Become a new member to get the complete report, code, data, and AI agent (including skill) for this project
Abstract
This paper answers the following specific questions:
- Why is it difficult for metro campus traffic monitoring to balance millisecond-level response with high-accuracy detection?
- How does the edge-cloud collaborative architecture compress detection latency to ≤30ms and scheduling to ≤100ms?
- How does the fused iForest, XGBoost, Autoencoder engine achieve 90%+ detection accuracy and 92.3% blocking rate on unlabeled traffic?
- How do 3D visualization and dynamic scheduling help operators quickly locate attack chains?
Abstract
This article addresses: (1) why metro traffic monitoring struggles to balance millisecond-level response with high detection accuracy; (2) how an edge-cloud architecture cuts detection latency to ≤30ms and scheduling to ≤100ms; (3) how a fused iForest-XGBoost-Autoencoder engine reaches 90%+ detection accuracy and 92.3% block rate on unlabeled traffic; (4) how 3D visualization and dynamic scheduling help operators locate attack chains quickly.
Introduction
Metro network traffic has grown exponentially in recent years. Traditional single-point cloud monitoring faces three major bottlenecks: detection lag, uneven computing power, and weak visualization. This paper proposes a “edge sensing – cloud decision – collaborative self-healing” three-tier architecture that combines millisecond-level lightweight handling with near-real-time deep decision-making, achieving over 90% attack detection accuracy and a 92.3% blocking rate.
We have encapsulated our hybrid enhanced dual-detection modeling experience into a conversational AI Agent and a reusable skill, helping campus operators quickly reproduce the entire monitoring and self-healing workflow in a no-code environment.
Read the original article and join the group to get the complete skill, data, and AI Agent of this paper, along with more of the latest AI insights and industry observations. You can exchange ideas and grow with 900+ industry professionals. We also provide manual Q&A to break down core principles, code logic, and business adaptation strategies; if you encounter code runtime issues, you can even enjoy 24-hour debugging support.
Complete report, code, data, and AI agent (including skill) for this project
Article Structure
        Campus Traffic Collection
           |
           v
   Edge-layer Lightweight Handling (≤30ms)
           |
     +-----+-----+
     |           |
     v           v
  Local Alert   Upload Summary to Cloud
                |
                v
   Cloud Deep Modeling & Scheduling (≤100ms)
                |
     +-----+----+-----+
     |     |    |     |
     v     v    v     v
  iForest XGBoost Autoencoder Scheduling Algorithm
     |     |    |     |
     +-----+----+-----+
           |
           v
   Detection-Alert-Scheduling-Handling Closed Loop
           |
           v
   3D Visualization & Self-Healing
Core Innovations
This project builds a three-tier “edge sensing – cloud decision – collaborative self-healing” architecture, integrating edge computing, cloud-native, AI modeling, and digital twin technologies. It breaks through the three major bottlenecks of traditional monitoring—detection lag, uneven computing power, and weak visualization—achieving ≤30ms millisecond-level response at the edge layer, ≤100ms near-real-time scheduling at the cloud layer, over 90% attack detection accuracy, and 92.3% attack blocking rate, forming a full-closed-loop protection system of “edge lightweight handling + cloud deep decision-making”, with both technical innovation, engineering deployability, and scenario adaptability.
Edge-Cloud Collaborative Architecture
This project breaks the limitations of the traditional single-architecture traffic monitoring, and innovatively builds a three-tier “edge sensing – cloud decision – collaborative self-healing” architecture, integrating edge computing, cloud-native, AI modeling, and digital twin technologies to achieve real-time monitoring, intelligent attack detection, and dynamic scheduling of metro campus traffic.
Edge Layer: Real-time Collection and Lightweight Handling, Building the Low-Latency First Line of Defense
Edge nodes are deployed in various campus buildings and core network device terminals, undertaking the dual functions of “front-end data collection + lightweight real-time handling”, focusing on low-latency response:
- Traffic collection: Deploy lightweight data collection agents to capture network traffic data (bandwidth utilization, packet size, connection count, etc.) from each campus building and link in real time, and complete basic data cleaning and format standardization locally to reduce cloud transmission pressure;
- Lightweight detection: Embed a trimmed iForest unsupervised model to identify high-frequency simple attacks such as DoS and port scanning in real time, enabling local alerts and rapid response to prevent attack spread;
- Local interaction: Works with the front-end 3D visualization terminal to push local traffic data in real time, supporting interactive functions such as displaying traffic summaries and bandwidth utilization when hovering the mouse over a building.
High-Frequency Questions in Advisor Defense
Why does the edge layer only use the trimmed iForest instead of a full deep learning model? Standard answer: Edge computing power is limited and a ≤30ms response is required. iForest is unsupervised, requires no labels, and infers extremely fast, which exactly covers high-frequency known attacks such as DoS and port scanning; complex and unknown attacks are handed over to the cloud deep model, making the division of labor most economical.
Cloud Layer: Global Scheduling and Deep Modeling for Intelligent Decision Upgrade
The cloud is deployed on cloud servers, undertaking the core functions of “deep analysis + global scheduling + model iteration”, and building an intelligent decision-making hub:
- Deep modeling and serviceization: Build an offline batch processing platform based on Hadoop, Hive, and Spark, perform deep feature engineering on the CICIDS dataset (dynamic class weight adjustment, stratified sampling), train a hybrid enhanced dual-detection engine that fuses iForest, XGBoost, and Autoencoder, and deploy it as a standardized interface via FastAPI;
- Real-time stream hub scheduling: Build a cloud-native real-time stream processing hub based on Kafka + Flink to receive lightweight data uploaded by the edge, invoke the AI model to complete deep detection of complex and unknown attacks, and achieve the dual verification of “edge light detection + cloud deep analysis”;
- Global intelligent scheduling: When traffic overflow or network attacks are detected, based on the global traffic situation, generate the optimal scheduling plan through a load-balancing + shortest-path fusion algorithm, and send it down to edge nodes and campus network devices;
- Model iteration and data management: Build a traffic data lake/warehouse to store historical traffic data and attack samples, periodically complete model iteration and push it to edge nodes, achieving continuous upgrade of “cloud iteration, edge deployment”.
High-Frequency Questions in Advisor Defense
Why choose the three-way fusion of iForest + XGBoost + Autoencoder instead of a single model? Standard answer: iForest unsupervisedly captures unknown attacks, XGBoost uses labels to improve known-attack accuracy, and Autoencoder uses reconstruction error to warn of anomalous traffic. The three complement each other to solve data imbalance and unknown-attack missed detection; a single model cannot cover both at the same time.
Most Popular Insights
- Python Employee Data Turnover Prediction: ADASYN Sampling CatBoost Algorithm, LASSO Feature Selection, and Dynamic Imbalance Handling with Multi-model Comparison Study
- R Distributed Lag Non-linear Model DLNM Analysis of Air Pollution and Health Data in a City: Multi-dimensional Visualization to Optimize Lag Effect Interpretation
- Python Analysis and Identification of Ancient Artifact Composition: Grey Relational Degree, Ridge Regression, K-means Clustering, Decision Tree Analysis
- Python TensorFlow OpenCV Convolutional Neural Network CNN Face Recognition System Construction and Application Practice
- Python Time Series Forecasting Comparison of Transformer, SARIMAX, RNN, LSTM, Prophet for Electricity Consumption, Retail Sales, Public Safety, and Traffic Accident Data
- MATLAB Bayesian Hyperparameter Optimization LSTM Prediction of Equipment Life—A Case Study of Aero-engine Degradation Data
- Python Google Play Store APP Rating Prediction: LASSO, Multiple Linear Regression, Ridge Regression Model Comparison Study
- Python + AI Prompt Diabetes Prediction Model Fusion Construction: Bernoulli Naive Bayes, Logistic Regression, Decision Tree, Random Forest, Support Vector Machine SVM Application
Collaborative Linkage Mechanism: Achieving a Seamless Edge-Cloud Closed Loop
The edge and cloud interact in real time through an encrypted communication protocol, forming a closed-loop system of hierarchical handling and global collaboration:
- Edge nodes collect traffic data, complete lightweight cleaning and simple attack detection, and upload “normal traffic summary + abnormal traffic details” to the cloud to reduce transmission pressure;
- The cloud invokes the AI model through the Flink real-time stream module to complete deep detection of complex and unknown attacks and generate scheduling decisions based on the global traffic situation;
- The cloud sends scheduling instructions and model update packages to edge nodes; the edge executes scheduling and updates the local model, synchronously feeding back execution results to form two-way linkage;
- In extreme scenarios (edge downtime, network interruption), the cloud takes over core monitoring and scheduling, and automatically synchronizes data after the edge recovers, ensuring high system availability.
Edge-Cloud Layered Comparison
| Dimension | Edge Layer | Cloud Layer | Collaborative Value |
|---|---|---|---|
| Deployment Location | Campus buildings, core network terminals | Cloud servers (cloud hub) | Distributed deployment, balancing response speed and global control |
| Computing Power Level | Lightweight computing power, low resource consumption | High-performance computing power, supporting large-scale parallel computing | Hierarchical computing power allocation, avoiding resource waste |
| Core Functions | Real-time collection, lightweight detection, local interaction | Deep modeling, global scheduling, model iteration, data management | Division of labor and collaboration, achieving the dual goals of “low latency + high intelligence” |
| Response Latency | ≤30ms (millisecond-level response) | ≤100ms (near-real-time scheduling) | Meets the core requirements of metro campus real-time monitoring |
| Technology Selection | Lightweight collection agent, trimmed iForest model | Hadoop/Spark, Kafka/Flink, FastAPI, hybrid AI model | Technology adapted to scenarios, highlighting engineering rationality |
Project Background and Industry Pain Points
Project Background
As digital city construction enters a deep-water zone, the scale of metro/campus networks continues to expand, and traffic data is growing exponentially. Network security has become the core bottleneck restricting urban digital transformation. According to authoritative industry data in 2024, the global metro network traffic grows at an average annual rate of 38%, and campus-level network attack incidents in China surged 42% year-on-year. Security incidents such as network paralysis caused by traffic overflow and information leakage caused by unknown attacks occur frequently, seriously affecting key areas such as government affairs, enterprise operations, and public services. The “ZhiLiuWei” metro real-time traffic monitoring security platform emerged at the right moment, innovatively building an edge-cloud collaborative architecture to comprehensively improve the security, real-time performance, and intelligence level of metro network traffic monitoring, deeply aligning with national network security strategic requirements.
Industry Pain Points
- Response lag: Traditional monitoring adopts a single cloud processing mode, where data transmission and analysis take a long time, making it impossible to achieve millisecond-level attack detection and traffic warning;
- Uneven computing power: A single architecture cannot achieve hierarchical computing power allocation; cloud resources are seriously wasted, and edge terminals lack computing power, making it difficult to support local real-time handling;
- Insufficient detection accuracy: Existing technologies mostly rely on shallow traffic feature extraction and single-model detection, and cannot deeply capture the complex patterns of network attacks and traffic overflow, leaving missed-detection and false-alarm rates high;
- Weak visualization: Lack of intuitive 3D dynamic visualization and scheduling demonstration tools makes it difficult to clearly restore traffic distribution, attack chains, and scheduling processes;
- Passive defense: The defense schemes of existing monitoring systems lack adaptive capabilities and perform laggingly when facing dynamic variant attacks and cross-regional traffic shocks.
Product Design Approach
This project takes “solving industry pain points and improving operation and maintenance efficiency” as its core, and builds a full-process integrated system of “data processing – feature extraction – visualization display – intelligent defense – dynamic scheduling”, relying on the edge-cloud collaborative architecture to achieve “edge lightweight handling + cloud deep decision-making”.
Core Design Principles
- Low latency: Lightweight handling at the edge layer achieves millisecond-level data collection and attack detection;
- High intelligence: Cloud deep modeling and global scheduling, combined with multi-model ensemble detection, improve attack recognition accuracy and scheduling rationality;
- High availability: Edge-cloud collaborative self-healing mechanism; the cloud takes over in extreme scenarios to ensure stable system operation;
- Reproducible: Full-link containerized deployment with standardized operating steps;
- Visualization: 3D dynamic visualization presentation, highlighting interactivity and intuitiveness.
Core Technical Path
- Batch-stream collaborative data processing: Combine Hadoop, Hive, Spark offline batch processing with Kafka, Flink real-time stream processing; the cloud completes deep analysis of historical traffic, and the edge completes rapid collection of real-time traffic;
- Deep feature analysis: Based on big data feature engineering, through high-order feature extraction (e.g., t-SNE, K-means) and secondary feature screening, combined with dynamic class weight adjustment and stratified sampling, deeply capture the complex patterns of network attacks and traffic overflow;
- Multi-model ensemble detection: Build a hybrid enhanced dual-detection engine that fuses iForest (unsupervised), XGBoost (supervised), and Autoencoder (deep learning), taking into account known-attack recognition and unknown-attack warning, and solving the data imbalance problem;
- Explainable visualization analysis: Build a 3D campus visualization and dynamic heatmap display system, combined with real-time charts, to intuitively present traffic distribution, attack chains, and scheduling processes;
- Intelligent adaptive scheduling: Based on a load-balancing + shortest-path fusion algorithm, achieve automatic scheduling when traffic overflows or network attacks occur, forming a full closed loop of “detection – alert – scheduling – handling”.
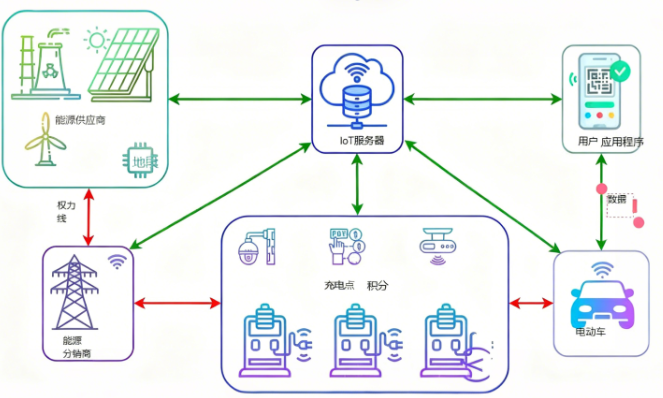
Application of Python TensorFlow CNN-LSTM-GRU Ensemble Model in Edge IoT Data for EV Charging Station Intrusion Detection
This paper proposes a CNN-LSTM-GRU ensemble deep learning model based on Python TensorFlow/Keras for network security intrusion detection of EV charging stations in edge IoT environments. Trained and tested on the real Edge-IIoTset dataset, it fuses CNN spatial features with LSTM and GRU temporal features, achieving 100% accuracy in binary classification and 96.90% accuracy in 15-class fine-grained threat identification, which is highly complementary to the “edge lightweight handling + cloud deep decision” attack detection approach of this paper.
Explore InsightsAchievement Presentation and Description
This system comprehensively presents the core achievements of the metro real-time traffic monitoring security platform based on real-time streaming and deep learning through a complete visualization analysis platform. The system architecture is clear and traceable, and the technical link is complete and reproducible. The front end adopts the Vue + Three.js + Echarts technology stack, and the back end relies on PySpark + TensorFlow + Flink to build an efficient data processing and AI modeling system.
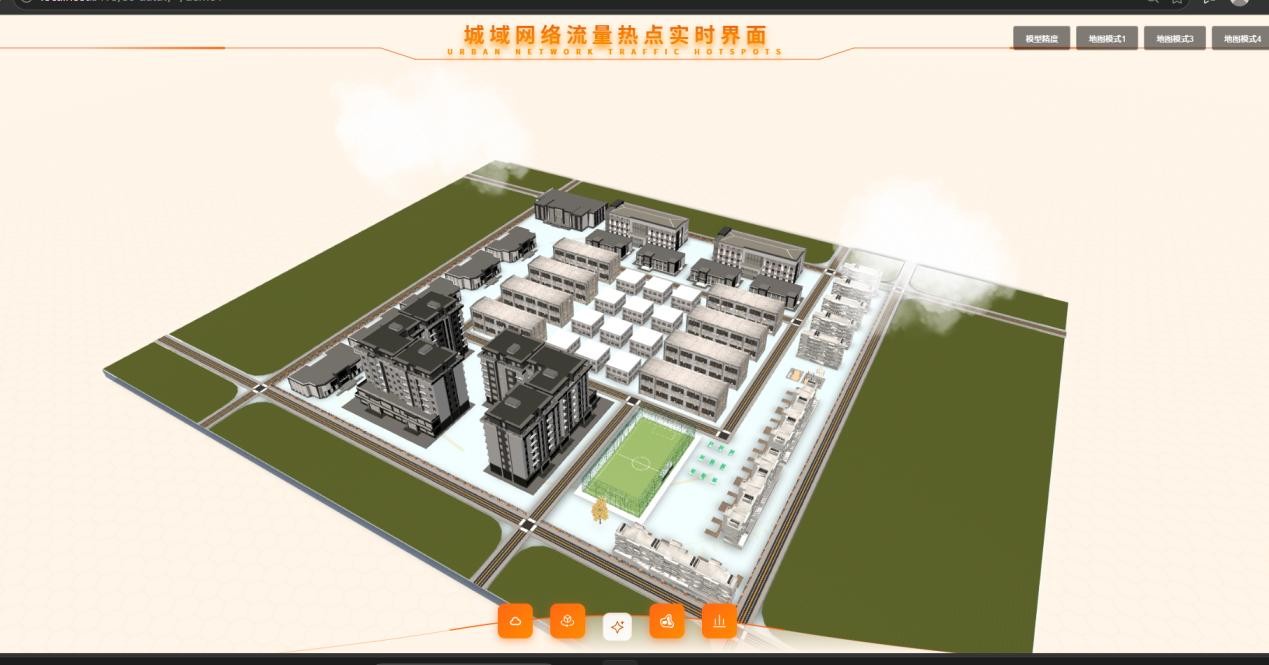
Figure 2 System Overall Interface Display
(The overall system interface includes an integrated display of the 3D campus visualization main interface, heatmap interface, and scheduling interface, marking core functional modules. The interface layout is clean and the color scheme is unified, highlighting a sense of technology and professionalism.)
Read the original article and join the group to get the complete content and more AI insights and industry observations, and exchange ideas and grow with 900+ industry professionals.
3D Visualization and Scheduling Display
High-end 3D campus models modeled and rendered through Three.js and professional tools, combined with dynamic heatmaps and dynamic scheduling route maps, realize the visual presentation of traffic monitoring and scheduling processes:
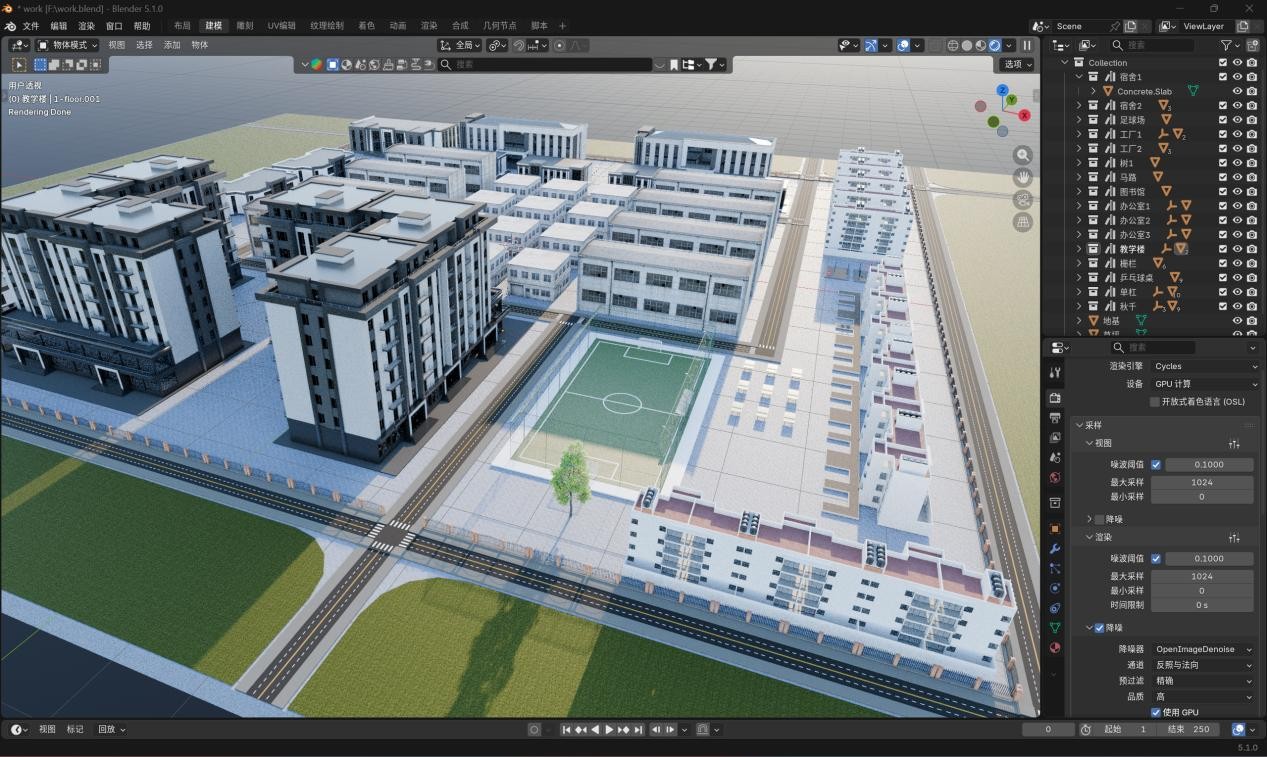
Figure 6 Digital Twin Effect
(1) Batch-Stream Collaborative Data Processing Display
Adopt a combined chart of “donut chart + time-series curve” to intuitively present the distribution characteristics and variation patterns of the CICIDS dataset and campus simulated traffic data:
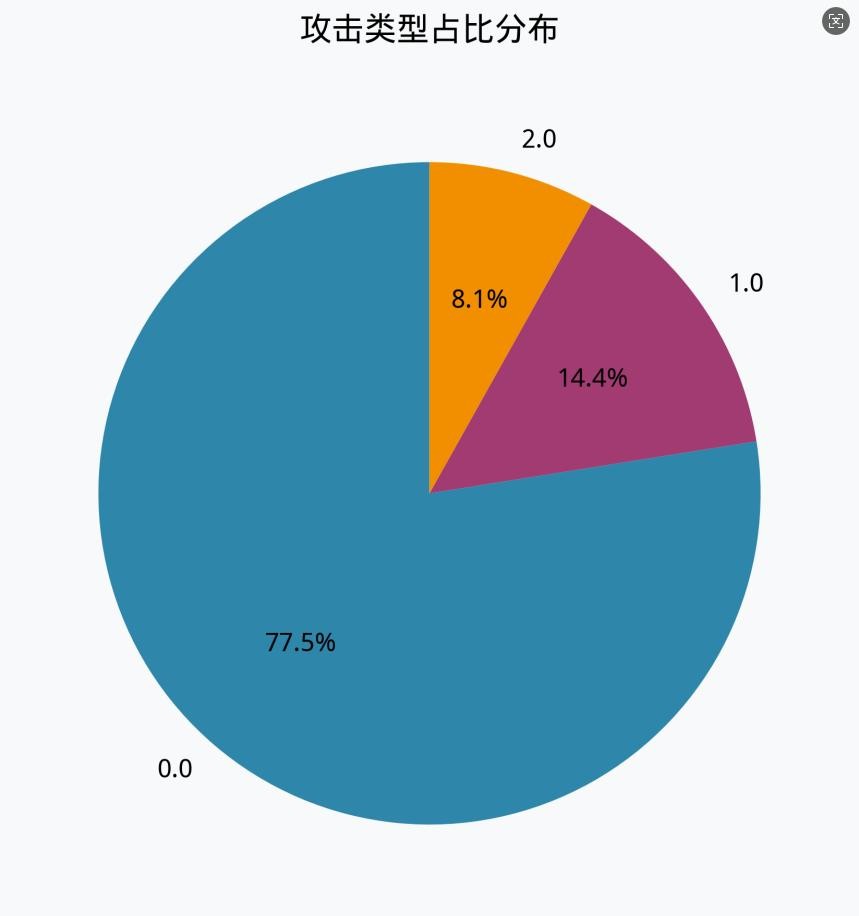
Figure 3 Batch-Stream Data Distribution
(The left donut chart shows the structural proportions of the training set, validation set, test set, and attack set of the offline batch processing data CICIDS and the real-time stream data campus simulation; the right time-series curve shows the traffic change trend in different periods.)
Among them, the offline batch processing data CICIDS undergoes stratified sampling and dynamic class weight adjustment to generate a high-quality training dataset; the real-time stream data is collected by edge nodes, lightly processed locally, and uploaded to the cloud. The two collaborate to provide solid data support for model training and real-time detection.
Deep Feature Analysis Achievements
Based on t-SNE dimensionality reduction and K-means clustering algorithm, the high-dimensional traffic features (bandwidth utilization, connection count, packet size, etc.) are projected into a two-dimensional space, and feature visualization is achieved through professional scatter plots:
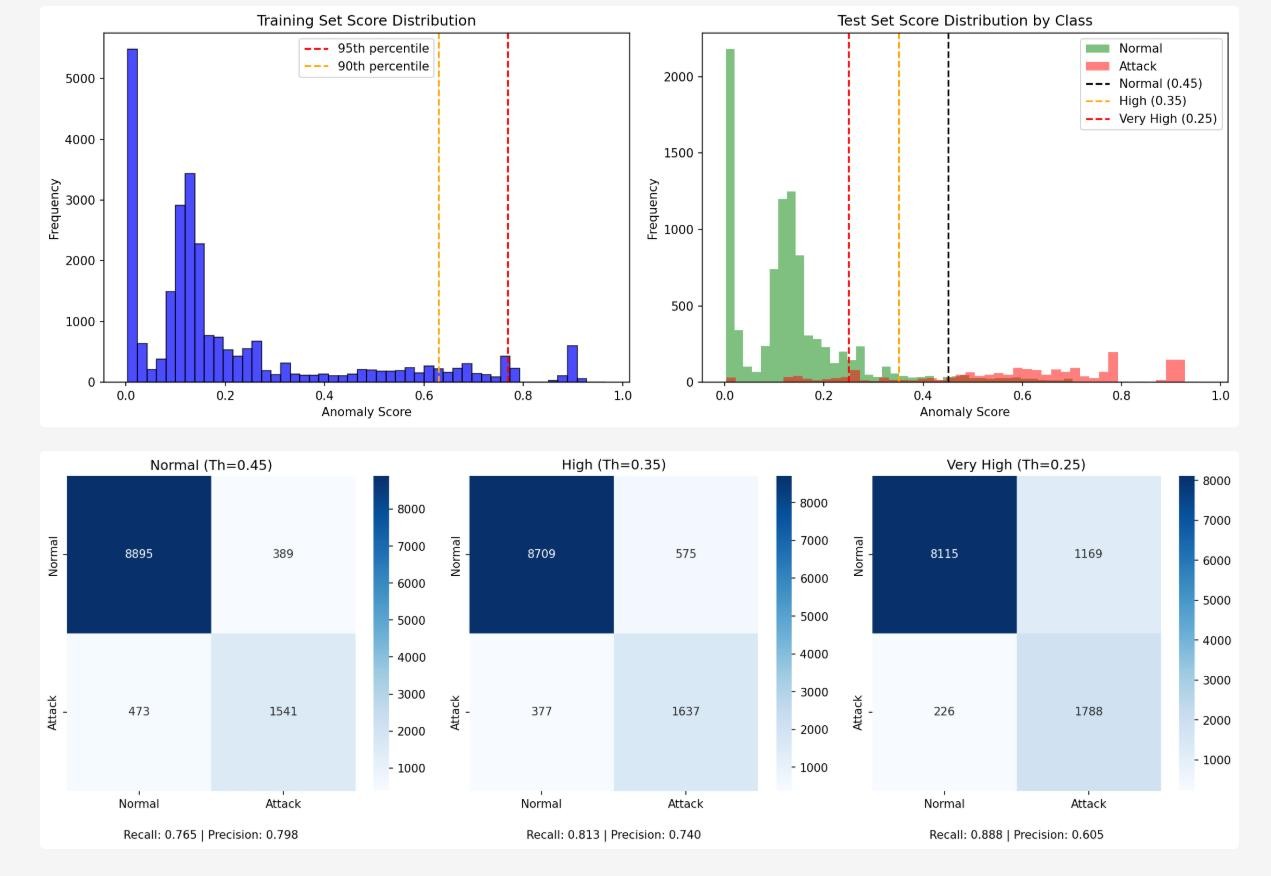
Figure 4 Traffic Feature Clustering and AI Modeling Effect Visualization
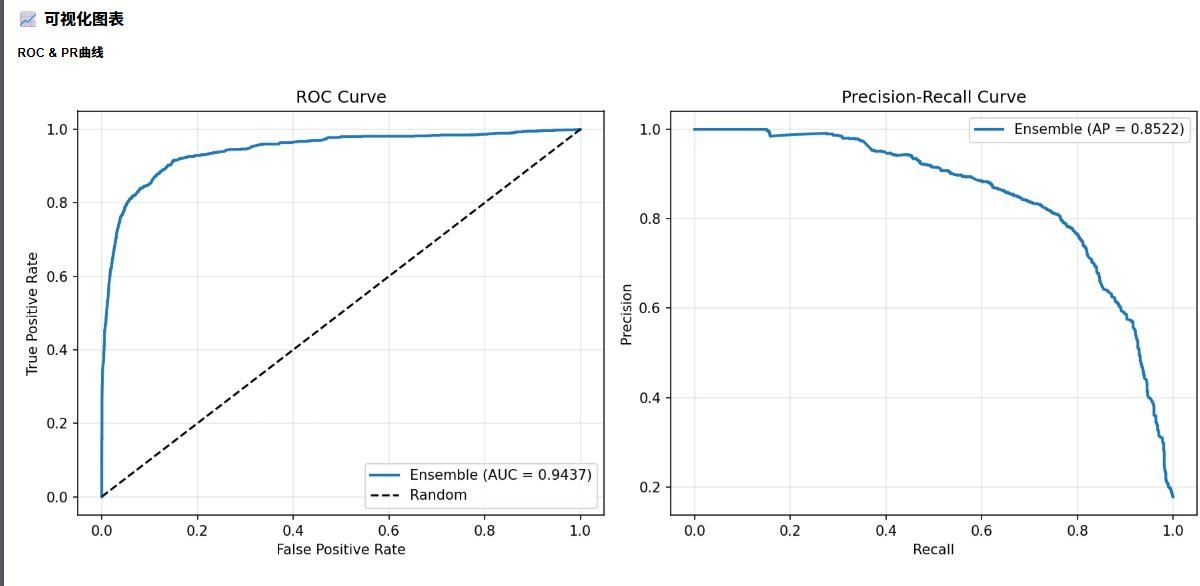
(The scatter plot uses different color encodings to distinguish the three types of traffic: normal traffic, known attacks, and unknown attacks, marking the abnormal aggregation areas in the feature space caused by attack triggers and traffic overflow.)
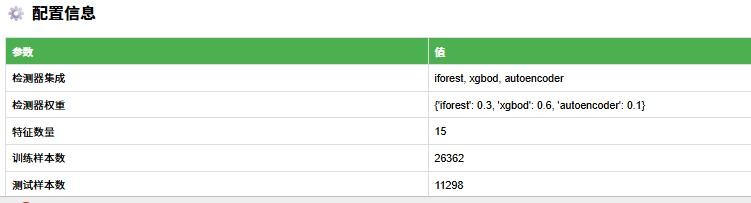
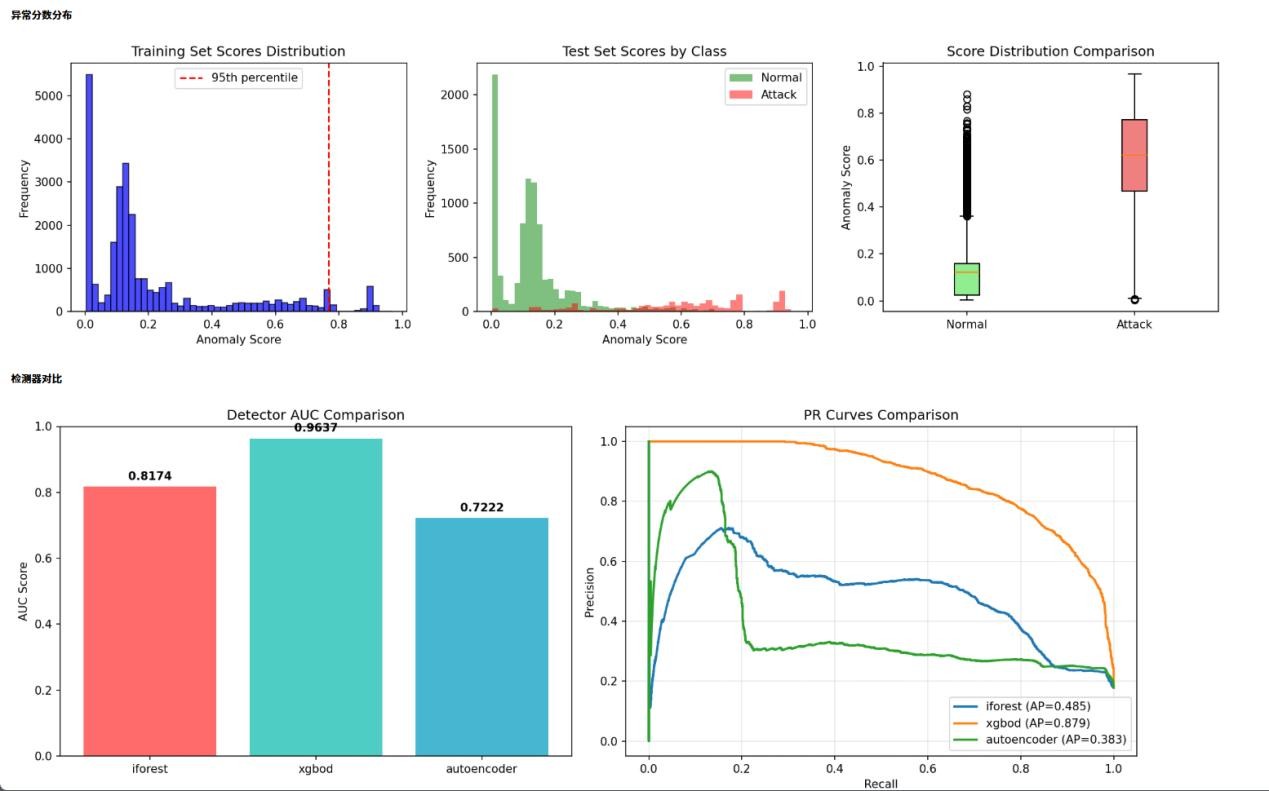
The color encoding clearly shows the clustering distribution of different types of traffic, and especially marks the abnormal aggregation phenomena in the feature space caused by attack triggers and traffic overflow, providing intuitive and precise feature support for attack detection.
Application Value and Scoring Fit
| Evaluation Dimension | Fit Points | Bonus Highlights | Risk Avoidance |
|---|---|---|---|
| Creativity & Topic Selection | Aligns with the “network security + real-time monitoring” hotspot; the edge-cloud collaborative architecture differs from similar single-module innovations | Architecture innovation + scenario adaptation, with unique technical highlights, fitting the innovation orientation | Avoid diluting core innovations, highlight project uniqueness, avoid homogenization |
| Technical Advancement & Comprehensiveness | Integrates cutting-edge technologies such as edge computing, cloud-native, AI modeling, and real-time stream processing, with reasonable technology selection | High technology fusion degree, strong engineering practicability | Avoid technology piling, reflect the rationality and practicability of technology fusion |
| Application & Effect | Solves practical pain points such as low latency and uneven computing power in campus traffic monitoring, with strong deployability | Supported by quantitative indicators (latency, accuracy, blocking rate), high deployment value | Respond to the “lab toy” doubt, strengthen practicability |
| System Design & Effect | Connects all modules with the collaborative architecture, forming a complete closed loop with clear logic | Strong system completeness, excellent visualization effect, reproducible operating steps | Avoid function dispersion, avoid demo lag and process confusion |
Complete System Operation Steps
To adapt to the core requirements of full-process reproducibility and no lag, standardized operation steps are formulated:
Pre-deployment Preparation
- Environment configuration: Set up the edge node and cloud server environment, install Docker containerized deployment tools, and configure encrypted communication permissions;
- Dependency installation: Install lightweight collection agent and trimmed iForest model dependencies on the edge node; install Hadoop, Spark, Kafka, Flink and other components on the cloud, and configure the FastAPI runtime environment and AI model dependencies;
- Data preparation: Import the CICIDS dataset into the cloud Hive data warehouse, complete missing value filling and outlier removal, and perform stratified sampling and dynamic class weight adjustment;
- Model deployment: Train the hybrid AI detection model in the cloud and encapsulate it as a standardized interface via FastAPI;
- Front-end deployment: Deploy the 3D visualization terminal, configure the Three.js rendering environment, and enable instanced rendering and frustum culling optimization.
Real-time Operation Steps
- Start edge node: Start the edge collection agent and local lightweight detection model, and open the communication link with the cloud;
- Start cloud services: Start the Kafka message queue, Flink real-time stream processing cluster, data lake/warehouse, and model interface services in sequence;
- Traffic simulation and processing: Start the campus traffic simulation generator; Flink consumes Kafka data and invokes the cloud AI model interface to complete attack detection;
- Front-end visualization operation: Open the 3D campus interface, hover over buildings to view real-time traffic summaries, switch to the heatmap to view traffic overflow distribution, and enter the scheduling interface to view dynamic routes;
- Abnormal scenario testing: Simulate traffic overflow and network attacks to verify the “detection – alert – scheduling” closed loop;
- Model iteration update: The cloud periodically retrains the AI model and pushes it to edge nodes.
Core Demonstration Steps
- Quick system startup: Start all edge and cloud services through a one-click startup script to demonstrate startup efficiency;
- 3D visualization demonstration: Demonstrate mouse hover interaction, heatmap display, and dynamic scheduling route drawing;
- Anomaly detection demonstration: Simulate unknown attacks to show the dual verification of edge light detection and cloud deep analysis;
- Scheduling closed-loop demonstration: Simulate traffic overflow to show the cloud automatically generating scheduling plans and the edge executing scheduling;
- Performance indicator display: Display quantitative indicators such as edge detection latency, cloud scheduling response time, and model detection accuracy in real time.
Developing a Hybrid Enhanced Dual Detection Engine Combining iForest, XGBoost, and Autoencoder to Implement Metro Network Traffic Data Security Monitoring | with AI agent, skill, and data
We sincerely thank Haiwen Luo (Luo Haiwen) for his contributions to this paper. He specializes in natural resource data analysis, and is proficient in Python, Web development, machine learning and deep learning, data cleaning, and engineering tasks, with long-term practical involvement in metro network traffic security projects.
Personnel Allocation Plan
Configure a professional team based on project modules, with clear division of labor and efficient collaboration:
| Role | Headcount | Core Responsibilities | Corresponding Project Module |
|---|---|---|---|
| Project Leader | 1 person | Coordinate overall project progress, coordinate collaboration among modules, and control technical route and scenario adaptation | Whole project |
| Big Data Development Engineer | 2 persons | Offline batch processing, feature engineering, data lake/warehouse, Kafka+Flink real-time stream deployment | Cloud batch-stream processing |
| AI Algorithm Engineer | 2 persons | Hybrid AI detection model training and optimization, FastAPI interface development, solving data imbalance | Cloud AI modeling |
| Back-end Development Engineer | 2 persons | SpringBoot + WebSocket development, edge-cloud communication protocol implementation | Back-end link, communication |
| Front-end Development Engineer | 2 persons | Three.js rendering and 3D interface optimization, develop real-time interface and data interaction | Front-end 3D visualization |
| 3D Modeling Engineer | 1 person | Campus 3D model polishing and lightweight optimization | Front-end 3D model |
| Testing & O&M Engineer | 1 person | Full-link testing, environment deployment, performance optimization, and quantitative indicator consolidation | Whole project testing & deployment |
Collaboration Mechanism and Progress Control
- Regular sync meetings: A 15-minute brief sync meeting every evening, and a progress review meeting once a week, adapted to time nodes;
- Module handover mechanism: After the big data completes data processing, it is synchronized to the AI algorithm module for training; after AI completes deployment, it is synchronized to the back end for interface docking; after the back end completes the link, it is synchronized to the front-end interaction;
- Emergency handling mechanism: The testing engineer follows up throughout the process, and each module reserves emergency time to ensure rapid problem response.
Conclusion
Core Problems and Solutions
- Problem 1: Why is it difficult for metro traffic monitoring to balance millisecond-level response with high-accuracy detection? → Solution: Adopt an edge-cloud layered architecture, where the edge performs ≤30ms lightweight handling and the cloud performs ≤100ms deep modeling, and the division of labor avoids single-point bottlenecks.
- Problem 2: How to ensure 90%+ detection accuracy on unlabeled traffic? → Solution: Fuse iForest unsupervised, XGBoost supervised, and Autoencoder reconstruction error warning; the three complement each other to solve data imbalance and unknown-attack missed detection.
- Problem 3: How can operators quickly locate attack chains? → Solution: 3D campus visualization + dynamic heatmap + dynamic scheduling route map, presenting traffic distribution, attack chains, and scheduling processes transparently.
Technical Innovation and Business Value
- Technical innovation: Propose a three-tier “edge sensing – cloud decision – collaborative self-healing” architecture, breaking through the three major bottlenecks of detection lag, uneven computing power, and weak visualization.
- Business value: Over 90% attack detection accuracy and 92.3% blocking rate; quantitative indicators of ≤30ms at the edge and ≤100ms at the cloud can be directly reused in campus, government, and enterprise scenarios.
- Expansion value: Supports distributed campus collaborative security assurance in federated learning scenarios, with cross-industry expansion potential in medical, financial, and other fields.
The author is an analyst in the field of metro network security, with many years of practical experience in edge computing and AI modeling.
The accompanying modeling of this paper—the directly usable AI Agent, complete code package, and empirical analysis—can be obtained by adding the assistant: tecdat_cn. We can provide full-process auxiliary academic compliance guidance and 1v1 modeling coaching services to help you successfully complete your research and pass your defense.

 AI算力浪潮下的PCB产业趋势报告:AI算力、CCL与钻针
 2026年中国宠物行业发展报告:猫经济、国产替代、宠物食品
 2026年光伏发展报告:主链续亏、反内卷、光储一体化
 员工离职风险预测系统:Stacking与XGBoost集成预警模型