本文并不表示R在数据分析方面比Python更好或更快速,我本人每天都使用两种语言。这篇文章只是提供了比较这两种语言的机会。
CSV文件包含纽约市的311条投诉。它是纽约市开放数据门户网站中最受欢迎的数据集。
“纽约市开放数据门户网站” 是一个特定的平台,用于提供各种数据资源。
运用大数据分析的方法对纽约市的 311 万条投诉进行研究。
具体可能包括对投诉内容进行分类、统计不同类型投诉的数量、分析投诉的趋势随时间的变化、挖掘投诉集中的区域等,
以更好地了解纽约市在各个方面存在的问题以及市民的关切点,为城市管理和决策提供依据。

本文中的 数据 每天都会更新,我的文件版本更大,为4.63 GB。
数据工作流程
install.packages("devtools")
library("devtools")
install_github("ropensci/plotly")
library(plotly)需要创建一个帐户以连接到plotly API。或者,可以只使用默认的ggplot2图形。
set_credentials_file("DemoAccount", "lr1c37zw81") ## Replace contents with your API Key使用dplyr在R中进行分析

想了解更多关于模型定制、咨询辅导的信息?
介绍
假设已安装sqlite3(因此可通过终端访问)。
$ sqlite3 data.db # Create your database
$.databases       # Show databases to make sure it works
$.mode csv
$.import <filename> <tablename>
# Where filename is the name of the csv & tablename is the name of the new database table
$.quit 
将数据加载到内存中。
library(readr)
# data.table, selecting a subset of columns
time_data.table <- system.time(fread('/users/ryankelly/NYC_data.csv',
                   select = c('Agency', 'Created Date','Closed Date', 'Complaint Type', 'Descriptor', 'City'),
                   showProgress = T))
kable(data.frame(rbind(time_data.table, time_data.table_full, time_readr)))| user.self | sys.self | elapsed | user.child | sys.child | |
|---|---|---|---|---|---|
| time_data.table | 63.588 | 1.952 | 65.633 | 0 | 0 |
| time_data.table_full | 205.571 | 3.124 | 208.880 | 0 | 0 |
| time_readr | 277.720 | 5.018 | 283.029 | 0 | 0 |
我将使用data.table读取数据。该 fread 函数大大提高了读取速度。
关于dplyr
默认情况下,dplyr查询只会从数据库中提取前10行。
library(dplyr)      ## Will be used for pandas replacement

# Connect to the database
db <- src_sqlite('/users/ryankelly/data.db')
db
数据处理的两个最佳选择(除了R之外)是:
- 数据表
- dplyr
预览数据
# Wrapped in a function for display purposes
head_ <- function(x, n = 5) kable(head(x, n))

head_(data)
| Agency | CreatedDate | ClosedDate | ComplaintType | Descriptor | City |
|---|---|---|---|---|---|
| NYPD | 04/11/2015 02:13:04 AM | Noise – Street/Sidewalk | Loud Music/Party | BROOKLYN | |
| DFTA | 04/11/2015 02:12:05 AM | Senior Center Complaint | N/A | ELMHURST | |
| NYPD | 04/11/2015 02:11:46 AM | Noise – Commercial | Loud Music/Party | JAMAICA | |
| NYPD | 04/11/2015 02:11:02 AM | Noise – Street/Sidewalk | Loud Talking | BROOKLYN | |
| NYPD | 04/11/2015 02:10:45 AM | Noise – Street/Sidewalk | Loud Music/Party | NEW YORK |
选择几列
| ComplaintType | Descriptor | Agency |
|---|---|---|
| Noise – Street/Sidewalk | Loud Music/Party | NYPD |
| Senior Center Complaint | N/A | DFTA |
| Noise – Commercial | Loud Music/Party | NYPD |
| Noise – Street/Sidewalk | Loud Talking | NYPD |
| Noise – Street/Sidewalk | Loud Music/Party | NYPD |
| Noise – Street/Sidewalk | Loud Talking | NYPD |
| Noise – Commercial | Loud Music/Party | NYPD |
| HPD Literature Request | The ABCs of Housing – Spanish | HPD |
| Noise – Street/Sidewalk | Loud Talking | NYPD |
| Street Condition | Plate Condition – Noisy | DOT |
使用WHERE过滤行

| ComplaintType | Descriptor | Agency |
|---|---|---|
| Noise – Street/Sidewalk | Loud Music/Party | NYPD |
| Noise – Commercial | Loud Music/Party | NYPD |
| Noise – Street/Sidewalk | Loud Talking | NYPD |
| Noise – Street/Sidewalk | Loud Music/Party | NYPD |
| Noise – Street/Sidewalk | Loud Talking | NYPD |
使用WHERE和IN过滤列中的多个值
| ComplaintType | Descriptor | Agency |
|---|---|---|
| Noise – Street/Sidewalk | Loud Music/Party | NYPD |
| Noise – Commercial | Loud Music/Party | NYPD |
| Noise – Street/Sidewalk | Loud Talking | NYPD |
| Noise – Street/Sidewalk | Loud Music/Party | NYPD |
| Noise – Street/Sidewalk | Loud Talking | NYPD |
在DISTINCT列中查找唯一值
随时关注您喜欢的主题
##       City
## 1 BROOKLYN
## 2 ELMHURST
## 3  JAMAICA
## 4 NEW YORK
## 5
## 6  BAYSIDE
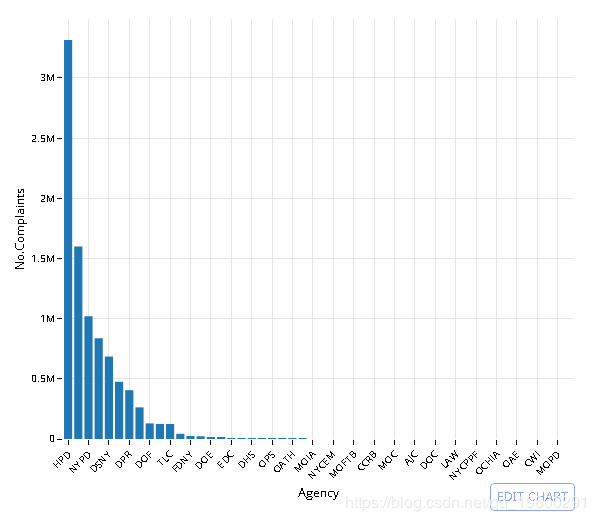
使用COUNT(*)和GROUP BY查询值计数
# dt[, .(No.Complaints = .N), Agency]
#setkey(dt, No.Complaints) # setkey index's the data

q <- data %>% select(Agency) %>% group_by(Agency) %>% summarise(No.Complaints = n())
head_(q)
| Agency | No.Complaints |
|---|---|
| 3-1-1 | 22499 |
| ACS | 3 |
| AJC | 7 |
| ART | 3 |
| CAU | 8 |
使用ORDER和-排序结果
交互版本:
静态版本:

数据库中有多少个城市?
# dt[, unique(City)]

q <- data %>% select(City) %>% distinct() %>% summarise(Number.of.Cities = n())
head(q)
##   Number.of.Cities
## 1             1818
让我们来绘制10个最受关注的城市
| City | No.Complaints |
|---|---|
| BROOKLYN | 2671085 |
| NEW YORK | 1692514 |
| BRONX | 1624292 |
| 766378 | |
| STATEN ISLAND | 437395 |
| JAMAICA | 147133 |
| FLUSHING | 117669 |
| ASTORIA | 90570 |
| Jamaica | 67083 |
| RIDGEWOOD | 66411 |
- 用
UPPER转换CITY格式。
| CITY | No.Complaints |
|---|---|
| BROOKLYN | 2671085 |
| NEW YORK | 1692514 |
| BRONX | 1624292 |
| 766378 | |
| STATEN ISLAND | 437395 |
| JAMAICA | 147133 |
| FLUSHING | 117669 |
| ASTORIA | 90570 |
| JAMAICA | 67083 |
| RIDGEWOOD | 66411 |
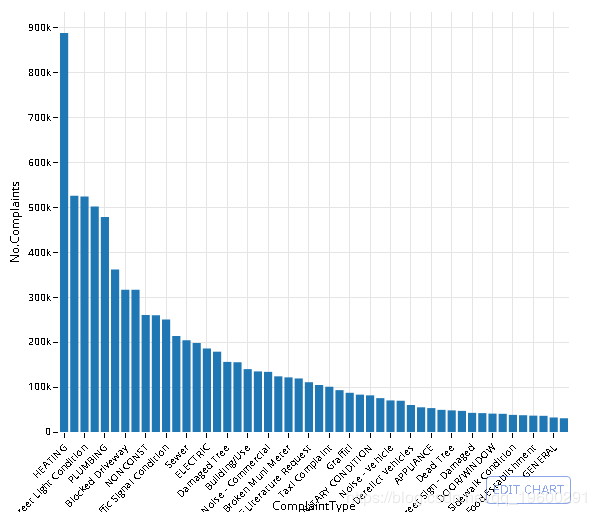
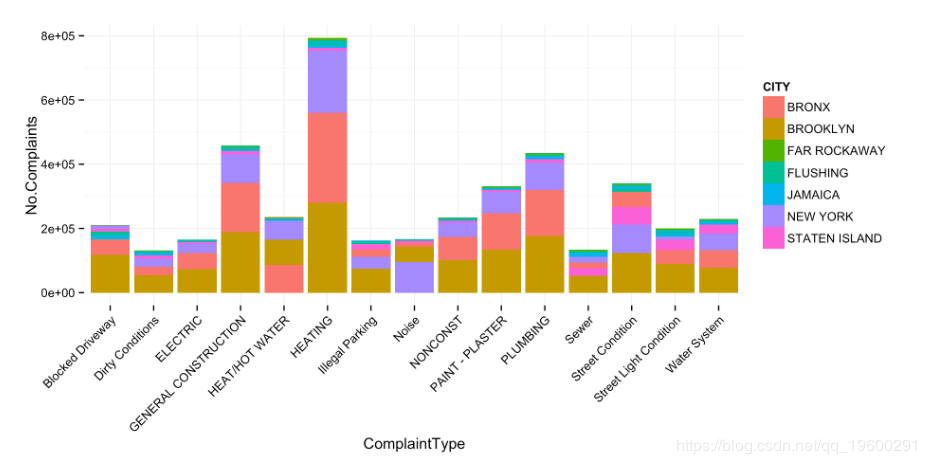
投诉类型(按城市)
# Plot result
plt <- ggplot(q_f, aes(ComplaintType, No.Complaints, fill = CITY)) +
            geom_bar(stat = 'identity') +
            theme_minimal() + theme(axis.text.x = element_text(angle = 45, hjust = 1))

plt

第2部分时间序列运算
提供的数据不适合SQLite的标准日期格式。
在SQL数据库中创建一个新列,然后使用格式化的date语句重新插入数据 创建一个新表并将格式化日期插入原始列名。
使用时间戳字符串过滤SQLite行:YYYY-MM-DD hh:mm:ss
# dt[CreatedDate < '2014-11-26 23:47:00' & CreatedDate > '2014-09-16 23:45:00',
#      .(ComplaintType, CreatedDate, City)]

q <- data %>% filter(CreatedDate < "2014-11-26 23:47:00",   CreatedDate > "2014-09-16 23:45:00") %>%
    select(ComplaintType, CreatedDate, City)

head_(q)
| ComplaintType | CreatedDate | City |
|---|---|---|
| Noise – Street/Sidewalk | 2014-11-12 11:59:56 | BRONX |
| Taxi Complaint | 2014-11-12 11:59:40 | BROOKLYN |
| Noise – Commercial | 2014-11-12 11:58:53 | BROOKLYN |
| Noise – Commercial | 2014-11-12 11:58:26 | NEW YORK |
| Noise – Street/Sidewalk | 2014-11-12 11:58:14 | NEW YORK |
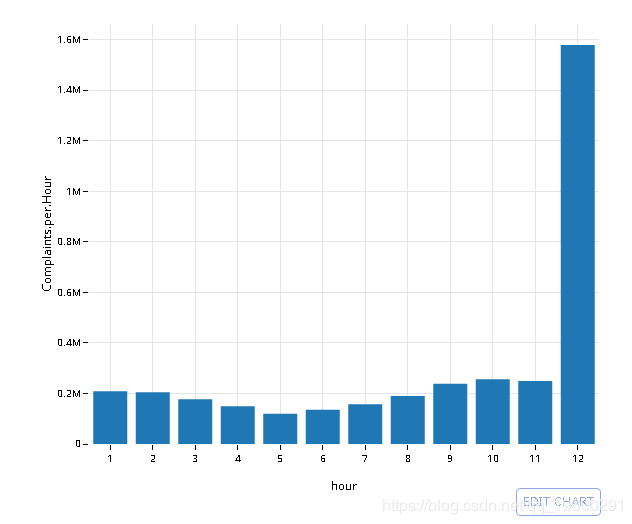
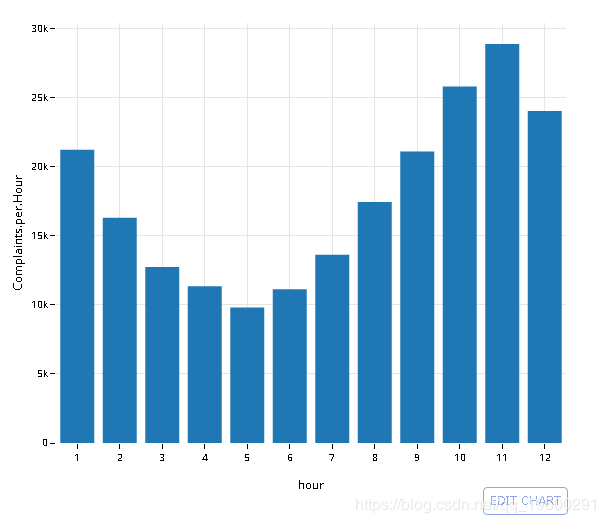
使用strftime从时间戳中拉出小时单位
# dt[, hour := strftime('%H', CreatedDate), .(ComplaintType, CreatedDate, City)]

q <- data %>% mutate(hour = strftime('%H', CreatedDate)) %>%
            select(ComplaintType, CreatedDate, City, hour)

head_(q)
| ComplaintType | CreatedDate | City | hour |
|---|---|---|---|
| Noise – Street/Sidewalk | 2015-11-04 02:13:04 | BROOKLYN | 02 |
| Senior Center Complaint | 2015-11-04 02:12:05 | ELMHURST | 02 |
| Noise – Commercial | 2015-11-04 02:11:46 | JAMAICA | 02 |
| Noise – Street/Sidewalk | 2015-11-04 02:11:02 | BROOKLYN | 02 |
| Noise – Street/Sidewalk | 2015-11-04 02:10:45 | NEW YORK | 02 |


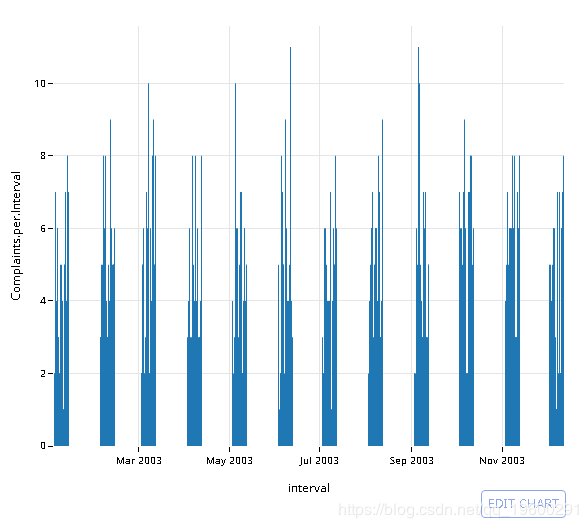
汇总时间序列
首先,创建一个时间戳记四舍五入到前15分钟间隔的新列
# Using lubridate::new_period()
# dt[, interval := CreatedDate - new_period(900, 'seconds')][, .(CreatedDate, interval)]

q <- data %>%
     mutate(interval = sql("datetime((strftime('%s', CreatedDate) / 900) * 900, 'unixepoch')")) %>%
     select(CreatedDate, interval)

head_(q, 10)
| CreatedDate | interval |
|---|---|
| 2015-11-04 02:13:04 | 2015-11-04 02:00:00 |
| 2015-11-04 02:12:05 | 2015-11-04 02:00:00 |
| 2015-11-04 02:11:46 | 2015-11-04 02:00:00 |
| 2015-11-04 02:11:02 | 2015-11-04 02:00:00 |
| 2015-11-04 02:10:45 | 2015-11-04 02:00:00 |
| 2015-11-04 02:09:07 | 2015-11-04 02:00:00 |
| 2015-11-04 02:05:47 | 2015-11-04 02:00:00 |
| 2015-11-04 02:03:43 | 2015-11-04 02:00:00 |
| 2015-11-04 02:03:29 | 2015-11-04 02:00:00 |
| 2015-11-04 02:02:17 | 2015-11-04 02:00:00 |
绘制2003年的结果


可下载资源
关于作者
Kaizong Ye是拓端研究室(TRL)的研究员。在此对他对本文所作的贡献表示诚挚感谢,他在上海财经大学完成了统计学专业的硕士学位,专注人工智能领域。擅长Python.Matlab仿真、视觉处理、神经网络、数据分析。
本文借鉴了作者最近为《R语言数据分析挖掘必知必会 》课堂做的准备。
非常感谢您阅读本文,如需帮助请联系我们!
每日分享最新报告和数据资料至会员群
关于会员群
- 本会员社群以垂直产业数据研究、深度行业报告分享、AI数据工具实操交流为核心定位;
- 入群即可解锁全行业数据内容免费阅读与下载权限,同步更新海内外一手优质研究报告文档与产业数据;
- 会员老用户享受专属 9 折续费优惠,可长期锁定社群全部权益;
- 为会员提供一对一免费 PDF 报告专属代找服务。
非常感谢您阅读本文,如需帮助请联系我们!
 R语言广义加性模型GAM、Tweedie分布的SaaS客户生命周期价值CLV预测研究——非线性关系捕捉与异方差性适配创新|附代码数据
 R语言优化沪深股票投资组合:粒子群优化算法PSO、重要性采样、均值-方差模型、梯度下降法|附代码数据
 Python实现Transformer神经网络时间序列模型可视化分析商超蔬菜销售数据筛选高销量单品预测|附代码数据
 Python对2028奥运奖牌预测分析:贝叶斯推断、梯度提升机GBM、时间序列、随机森林、二元分类教练效应量化研究


