There are two evaluation criteria for cluster validity: one is the external standard, and the clustering result is excellent by measuring the consistency of the clustering result and the reference standard; the other is the internal index, which is used to evaluate the same clustering algorithm. The excellent degree of clustering results under different clustering conditions is usually used to determine the optimal clustering number of the data set.
A method
for determining the optimal cluster number For internal indicators, there are usually three types: indicators based on data set fuzzy partitioning; indicators based on data set sample geometry; indicators based on data set statistical information. The index based on the dataset sample geometry evaluates the clustering results according to the statistical characteristics of the dataset itself and the clustering results, and selects the optimal clustering number according to the merits of the clustering results. These indicators are Calinski-Harabasz(CH). Indicators, Davies-Bouldin (DB) indicators Weighted inter-intra (Wint) indicators, Krzanowski-Lai (KL) indicators, Hartigan (Hart) indicators, In-Group Proportion (IGP) indicators. This paper mainly introduces the Calinski-Harabasz (CH) indicator and the Davies-Bouldin (DB) indicator.
(1) The CH indicator
CH indicator describes the tightness through the intra-class dispersion matrix, and the inter-class dispersion matrix describes the degree of separation. The indicator is defined as
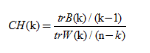
Where n is the number of clusters, k is the current class, trB(k) is the trace of the inter-class dispersion matrix, and trW(k) is the trace of the intra-class dispersion matrix. A more detailed explanation of the formula can be found in the paper “A dendrite method for cluster analysis”.
It can be concluded that the larger CH, the closer the class itself is, and the more dispersed the class and class, that is, the better clustering result.
(2) index DB
DB-spacing metrics class described by the divergence of the sample of each cluster center is defined as
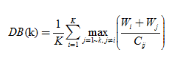
where, K is the number of clusters, Wi represents all the classes Ci samples the average distance to the cluster center thereof, Wj represents the average distance from all samples in class Ci to the center of class Cj, and Cij represents the distance between the centers of class Ci and Cj. It can be seen that the smaller the DB, the lower the similarity between the classes and the classes, thus corresponding to the better clustering results.
The process of determining the optimal cluster number is generally as follows: given the range of K [Kmin, Kmax], the same clustering algorithm is run on the data set using different cluster numbers K, and a series of clustering results are obtained for each The result is the value of the validity index, and finally the individual index values are compared. The number of clusters corresponding to the best index value is the optimal cluster number.
Two experimental results
in Matlab function evalclusters provides four methods to assess the effect of clustering, including ‘CalinskiHarabasz’, ‘DaviesBouldin’, ‘gap’, ‘silhouette’. Select a set of data to evaluate the clustering effect. Here, the ‘Calinski Harabasz’ and ‘DaviesBouldin’ indicators are selected respectively, and the clustering algorithm selects k-means.
(1) CH index
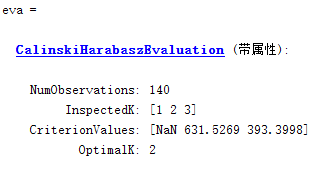
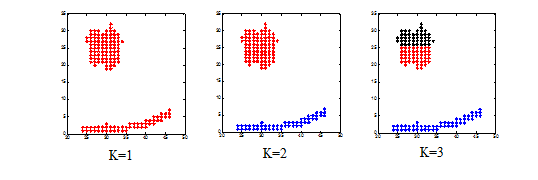
given K value range of 1 to 3, each cluster calculated results CH index, the maximum index value corresponding to a K value of the optimal value.
(2) index DB
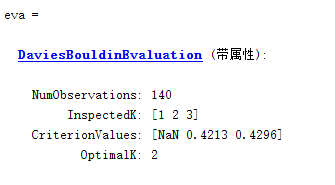
given K value range of 1 to 3, each cluster is calculated result DB index, the maximum index value corresponding to a K value of the optimal value.
Note: NAN occurs because neither of the two methods is applicable and the number of clusters is 1.
cluster = zeros(size(data,1),3);
for i=1:3
cluster(:,i) = kmeans(data,i,'replicate',5); %%%保存每次聚类结果
end
eva = evalclusters(data,cluster,'DaviesBouldin');
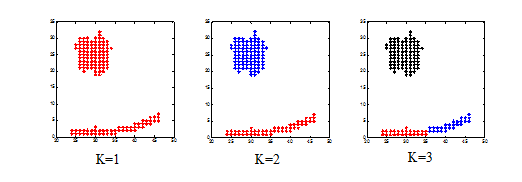
subplot(1,3,1);
plot(data(cluster(:,1)==1,1),data(cluster(:,1)==1,2),'r*');
hold on
subplot(1,3,2);
plot(data(cluster(:,2)==1,1),data(cluster(:,2)==1,2),'r*');
hold on
plot(data(cluster(:,2)==2,1),data(cluster(:,2)==2,2),'b*');
hold on
subplot(1,3,3);
data=[c1 r1];
[idx,ctrs] = kmeans(data,3);
plot(data(cluster(:,3)==1,1),data(cluster(:,3)==1,2),'r*');
hold on
plot(data(cluster(:,3)==2,1),data(cluster(:,3)==2,2),'b*');
hold on
plot(data(cluster(:,3)==3,1),data(cluster(:,3)==3,2),'k*');
hold on
非常感谢您阅读本文,有任何问题请在下面留言!
1
1
关于作者
Kaizong Ye是拓端研究室(TRL)的研究员。
本文借鉴了作者最近为《R语言数据分析挖掘必知必会 》课堂做的准备。
 R语言与MATLAB定制开发SARIMAX双模型预测与PSO多目标优化消费券发放策略|附AI智能体、代码和数据
 Python随机森林、聚类与XGBoost融合模型实现穿戴设备数据身体活动监测与行为分析|附AI智能体、代码和数据
 DeepSeek高维城市经济与宜居度面板数据分析——PGSA寻优、聚类、CNN、ARIMA、GM(1,1)与智能交互|附代码数据
 LLM与词袋、TF-IDF在新闻数据集上分类与聚类多维对比 | 附代码数据

