
2026 Humanoid Robot Industry Research Report: Mass Production Year, Core Components and Investment Landscape
In 2025, over 140 humanoid robot complete-machine enterprises crowded into the same track, with 330 products launched in a cluster, and financing amounts surged 326% year-on-year. The data is socrazy that this industry became the most crowded hard-tech track of 2025.
In 2025, over 140 humanoid robot complete-machine enterprises crowded into the same track, with 330 products launched in a cluster, and financing amounts surged 326% year-on-year. The data is socrazy that this industry became the most crowded hard-tech track of 2025. Behind thefever, the National Development and Reform Commission poured a bucket of cold water: more than half of the enterprises are startups or cross-industry entrants, and the risk of products “clustering” onto the market and compressed R&D space needs to be prevented. But where danger lies is often where excess returns hide.
This structural misalignment of “overheated complete machines, scarce upstream” is exactly the clearest signal we found after spending three weeks and reading ten latest industry reports. Competition at the complete-machine level has already turned white-hot — Zhíyuán and Unitree alone accounted for over 70% of shipment share, with the remaining 140 companies fighting over scraps. But upstream components like ball screws, motors, reducers, and dexterous hands still have a localization rate hovering around 30-40%, with precision and lifespan an order of magnitude behind Japanese and German equivalents. The gap is the opportunity.
We spread out ten reports from sources including the Robotics Lecture Hall, HCR Huichen, New Strategy Consulting, and major securities research institutes, cross-validating different predictions on the same domain, and found conclusions that kept our team debating all day. The mass production experience from the automotive industry is being copied verbatim into the robotics industry, but the real cost of yield ramp-up is greatly underestimated. The domestic substitution of laparoscopic surgical robots is not a gradual catch-up, but a leapfrog structural opportunity — grassroots hospitals are emerging as the biggest variable. More critically, the market has universally overestimated humanoid robot shipments in 2028 while significantly underestimating the investment value of core components in 2026 — this pricing misalignment window will not stay open for long.
This is not an analysis written sitting in an office flipping through reports. Every data point has been cross-validated by at least two sources, and all judgments can be traced back to specific charts and infographics. We don’t produce data; we serve as translators between datasets — translating the intersections of ten reports into a decision framework you can use.
The insights in this report reference the “Robotics Lecture Hall: 2026 Embodied Intelligence and Humanoid Robot Industry Research Report” and 100+ humanoid robot industry research reports and data available at the end. The complete report, data charts, and latest reference report collection have been shared in the exchange group. Check the original text to view, join the group for consultation, customize data and reports, and grow together with 800+ industry professionals.

Become a new member to access the complete humanoid robot industry research report, code, data, and AI agents
Abstract
This report addresses the following core questions:
1. What is the global humanoid robot market size and growth rate in 2026?
2. Where is the domestic substitution window for core components (motors, ball screws, reducers)?
3. What are the supply chain bottlenecks and breakthroughs in the mass production era?
4. At what stage is the domestic substitution process for laparoscopic surgical robots?
5. What are the investment themes and risk avoidance strategies for the next 3 years?
Abstract: This report synthesizes findings from over 10 industry reports on the humanoid robot sector to address five core questions: market size projections for 2026, domestic substitution timelines for critical components (motors, ball screws, reducers), supply chain bottlenecks in the mass production era, progress of domestic laparoscopic surgical robot substitution, and investment strategies with risk mitigation for the next three years. The analysis covers policy catalysis, industrial chain investment mapping, cross-industry integration patterns, core component technology breakdowns, global competitive dynamics, and a comprehensive risk landscape. Key findings indicate that 2026 marks a pivotal inflection point with component-level domestic substitution accelerating, automotive supply chain models being replicated, and valuation gaps emerging between market expectations and industrial reality.
Chapter 1: Policy Catalysis Anchors the “National Team” for Embodied Intelligence in Beijing, Shanghai, and Shenzhen
29 complete-machine enterprises cluster in Haidian, Beijing. At Zhiyuan Robotics in Pudong, Shanghai, the core team is entirely Huawei-background. The 10-kilometer “Robotics Valley” from Nanshan to Yang’aitang in Shenzhen houses over a thousand supporting enterprises.
China’s humanoid robot policy ecosystem is shifting from “encouraging innovation” to “putting real money where the mouth is.” Since 2025, the Ministry of Industry and Information Technology and the National Development and Reform Commission have issued a flurry of special policies — the volume of which exceeds the previous three years combined. Beijing’s embodied intelligence special plan is the first district-level version nationally, Shenzhen’s component localization rate has already surged past 90%, and Shanghai has thrown out a 50-billion-yuan industrial parent fund over three years, placing robots on the first batch of key investment lists.
The three-city pattern is no accident. Beijing produces the “brain” — Tsinghua-affiliated and CAS Institute of Automation-affiliated startups are dense, with Galaxy General founded by Peking University assistant professor Wang He, Xingdong Jiyuan led by Chen Jianyu from Tsinghua’s Interdisciplinary Graduate School, and Accelerating Evolution’s founder Cheng Hao, an alumni of Tsinghua’s Department of Automation, whose advisor Zhao Mingguo directly joined as chief scientist. Just along one street in Haidian, you could round up ten humanoid robot teams with Tsinghua backgrounds. Shanghai produces the “arms” — Zhiyuan, Fourier, and Kepler in Pudong have formed a mass-production cluster from prototype to small-batch, with the completeness of the precision machining, electromechanical systems, and automotive equipment supply chain being unique nationwide. Shenzhen produces the “legs” — UBTECH’s Walker series secured orders exceeding 1.3 billion yuan in 2025, with annual production capacity breaking through 1,000 units, and Shenzhen’s supply chain achieves hardware iteration at a pace of one-week prototyping and one-month solution delivery.
The commonality among these three cities is that all four pieces of the puzzle — talent, supply chain, capital, andapplication scenarios — are fully assembled. Most other cities only have one or two of these pieces.
However, on the flip side of the policy dividend: who can survive after subsidies retreat? This is not paranoia. Among 325 financing events in 2025, the top 10 by financing amount consumed over 14 billion yuan, and the Matthew effect has already appeared. After cross-comparing six policy reports, our judgment is — look at components, not complete machines. The subsidy competition at the complete-machine level has already turned white-hot, with local governments competing to “adopt” star enterprises. But upstream subsidies for ball screws and reducers are still being bolstered, with fewer participants, higher technical barriers, and longer subsidy validity periods.
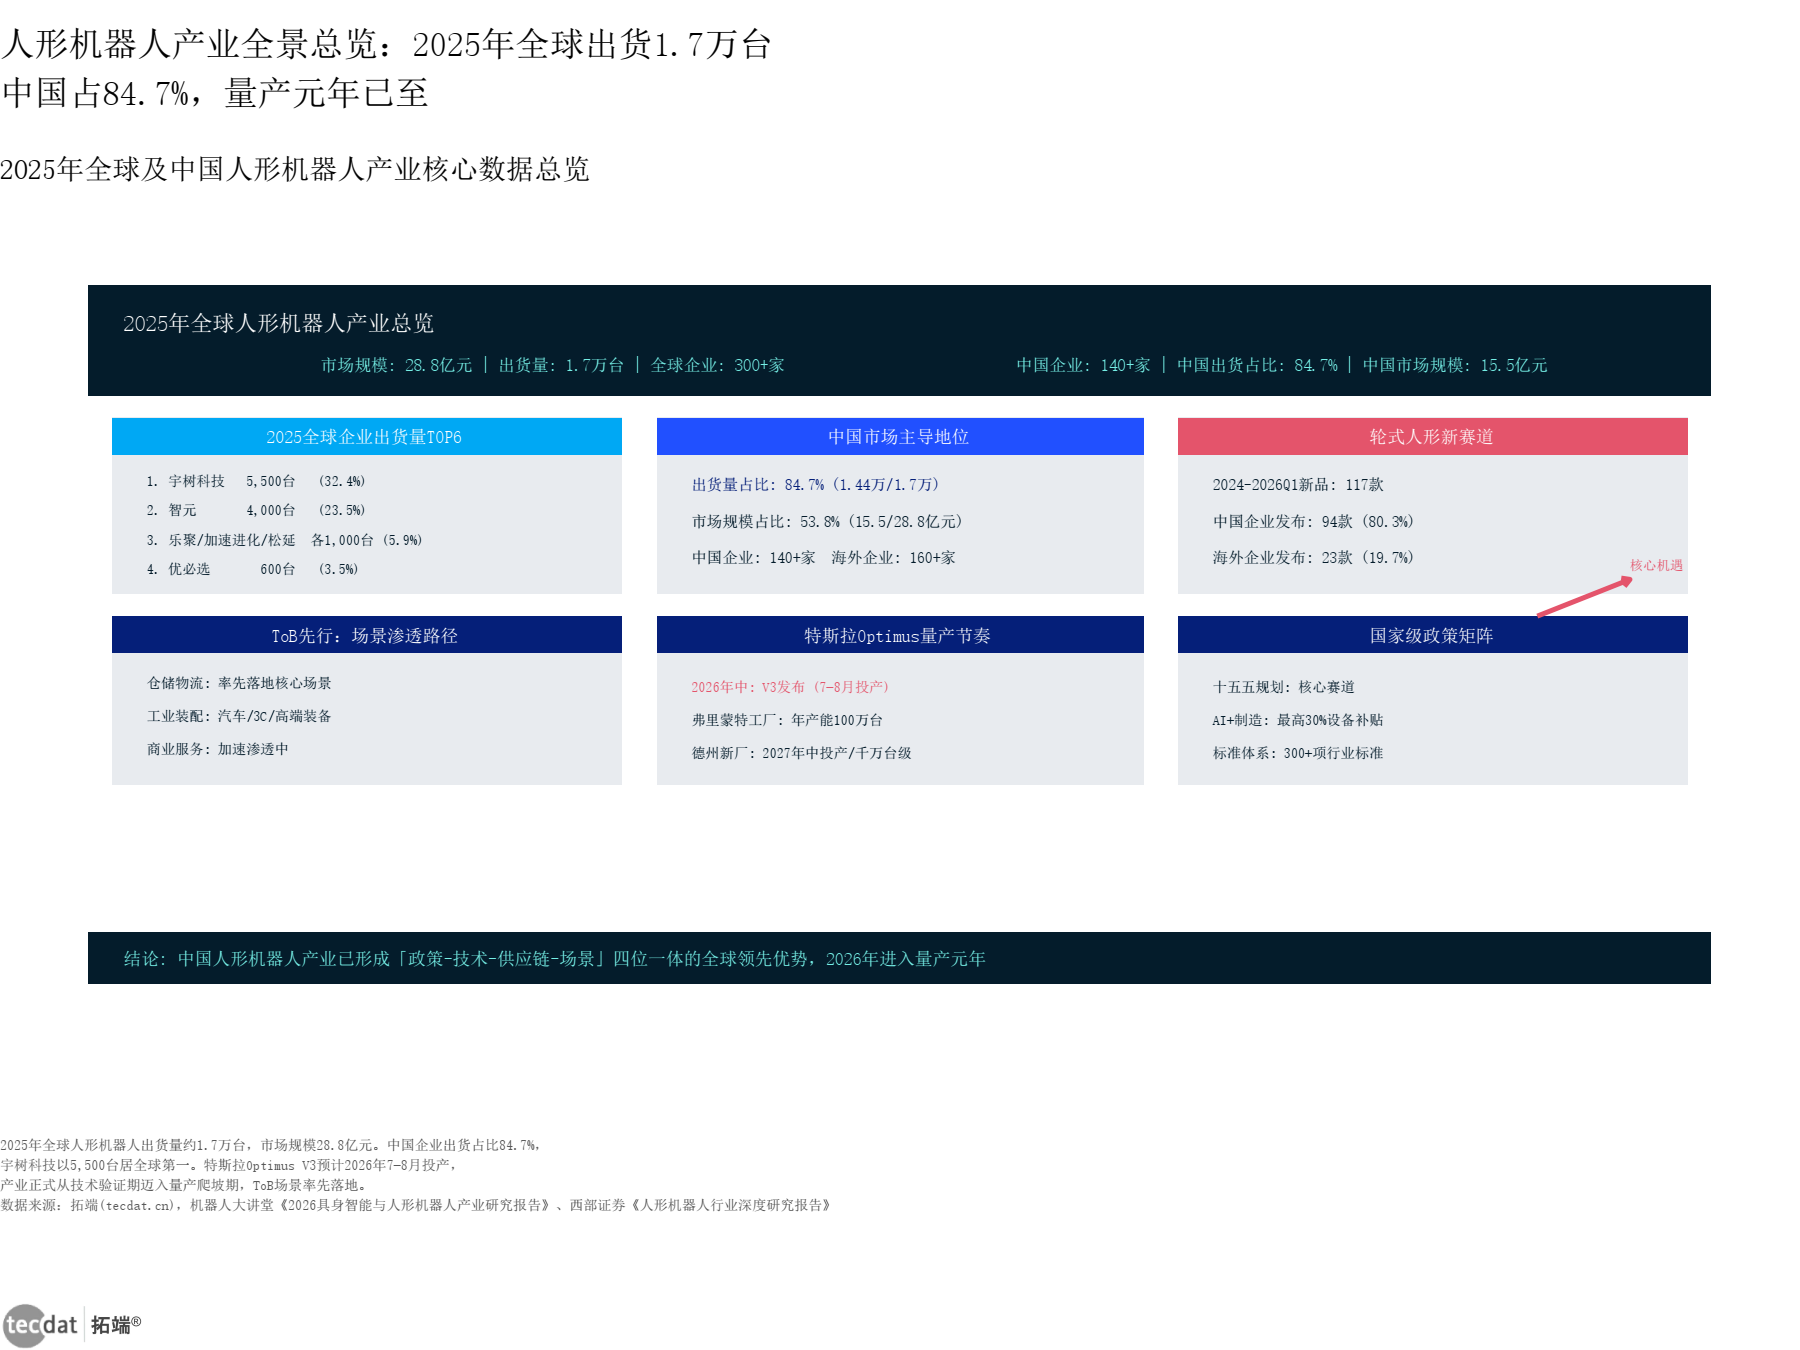
Figure 1: Industry Development Stage and Policy Support Intensity – Quadrant Matrix (Data Chart 1)
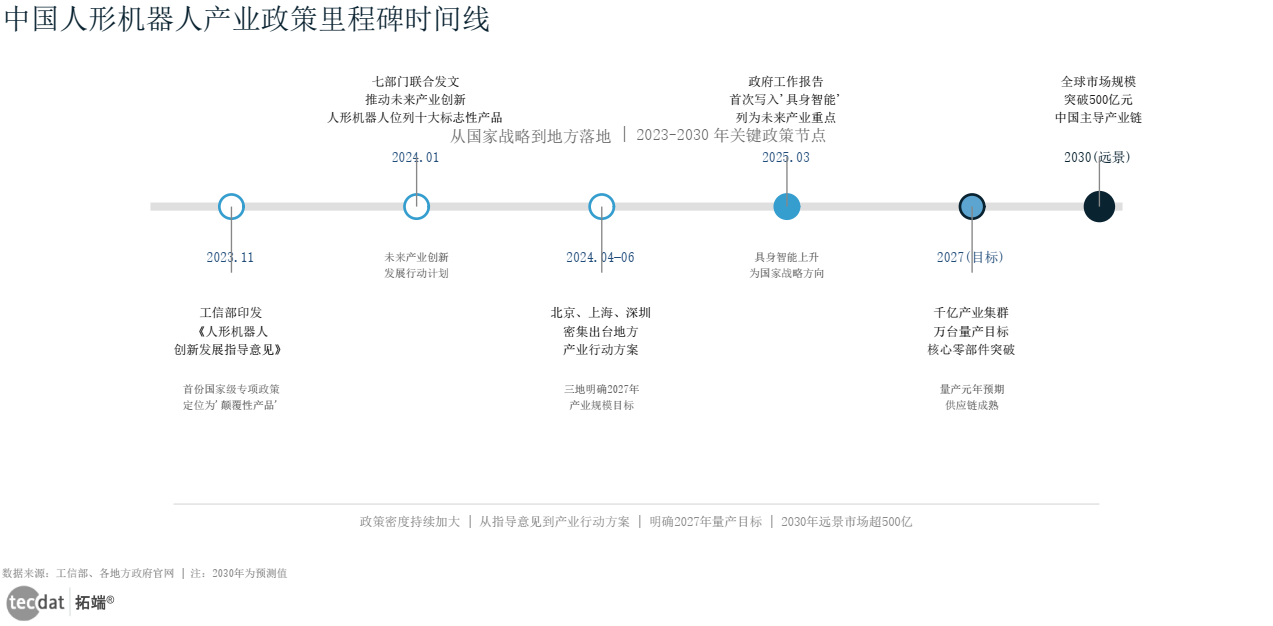
Figure 1 data EXCEL and chart PDF templates have been shared to member group
Chapter 2: Industrial Prosperity and Market Size: Global Track Entering Rapid Ascension Phase
The global humanoid robot market is expanding at a compound annual growth rate exceeding 53%. By 2030, this track will break through 240 billion yuan — equivalent to four times the 2024 global surgical robot market. But what’s truly interesting is not the total volume, but the structure.
China accounts for nearly 90% of global shipments. Zhiyuan and Unitree alone contributed 75% of global shipments in 2025, while Tesla delivered only 150 units throughout the year. This data is explosive enough in any industry. But breaking down the income statement, the lion’s share of components, algorithms, and core patents still remains in foreign hands — harmonic reducers from Japan’s Harmonic Drive, ball screws from Germany’s Schaeffler, and computing platforms from Nvidia in the US. Volume in China, profits overseas. This structure resembles the smartphone industry from a decade ago, when China accounted for over 70% of global assembly volume but less than 20% of profits. The difference is that this time China’s supply chain catch-up speed is noticeably faster, and the transition cycle from “volume” to “profits” is expected to compress from ten years to five.
Looking at industrial robot installations, China grew nearly threefold over the past five years, breaking through 350,000 units in 2025 and ranking first globally for nine consecutive years. This industrial automation foundation provides a natural training ground for the humanoid robot supply chain — servo motors, controllers, and sensors on production lines highly overlap with the core components used in humanoid robots.
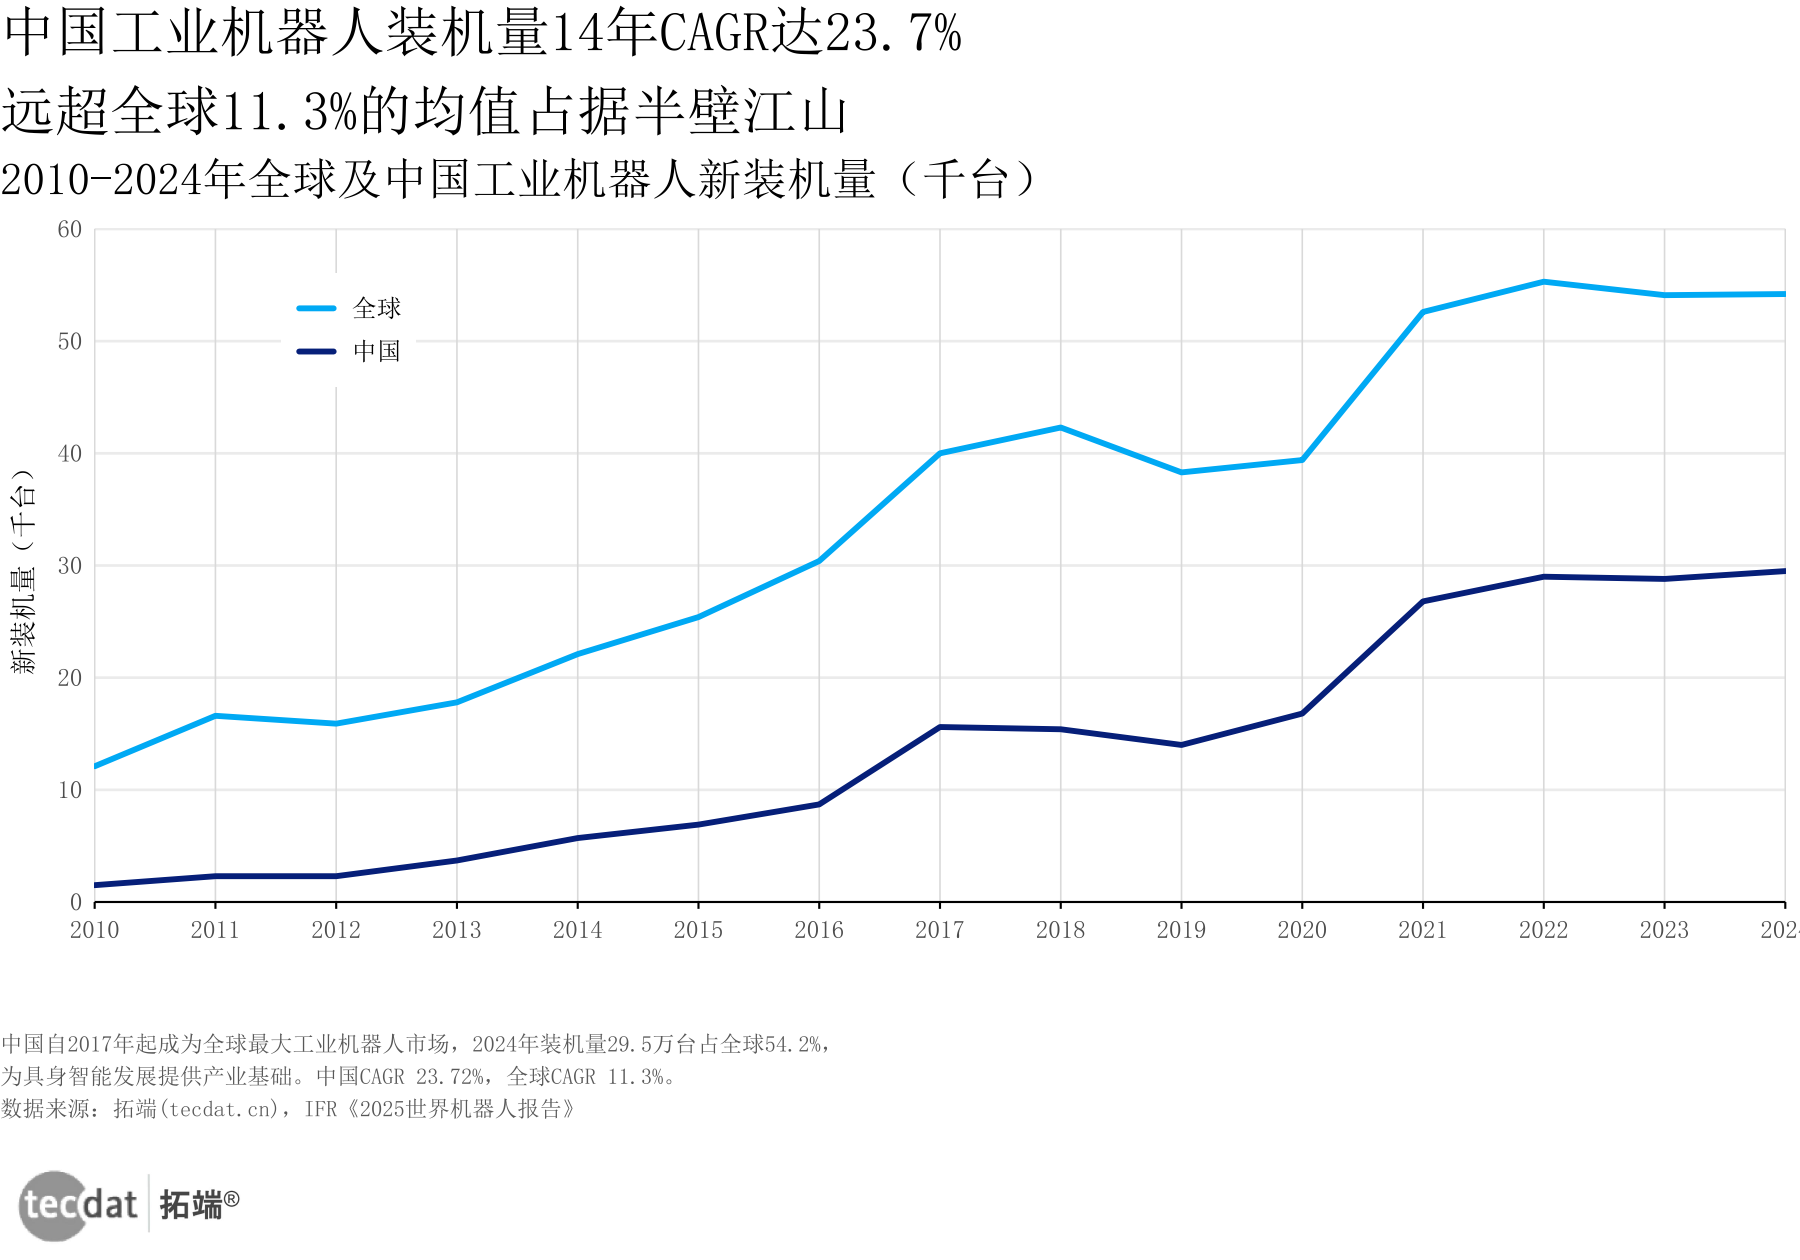
Figure 2: Industrial Robot Installations – Dual-Axis Chart (Data Chart 2)
This article is an excerpt from Tecdat’s “2026 Humanoid Robot Industry Research Report: Mass Production Year, Core Components and Investment Landscape.” To obtain the full content, please search and view on the Tecdat official website.
Related Articles |2026 Robotics Industry Frontier Insights Report: Humanoid and Special Robots, from Certification to Manufacturing to Consumption
In 2025, scientific research and education consumed over 70% of total shipments. Commercial consumption applications accounted for less than 20%, and industry applications less than 10%. This scene distribution reveals a critical fact — the current main battlefield for humanoid robots is not in factories or homes, but in laboratories. Scientific research institutions are paying tuition fees for the industry with real money, helping enterprises validate algorithms, accumulate data, and hone products.
The true value of scene distribution lies not in describing “the present,” but in predicting “the next step.” Starting from 2026, with Tesla Optimus V3 entering factory training, Zhiyuan Robot launching theElf series for industrial scenarios, and UBTECH Walker series securing automotive factory bulk orders, the commercial application share will see a nonlinear jump. By 2028, the shipment share of industrial manufacturing scenarios is expected to leap from single digits to over 30%.
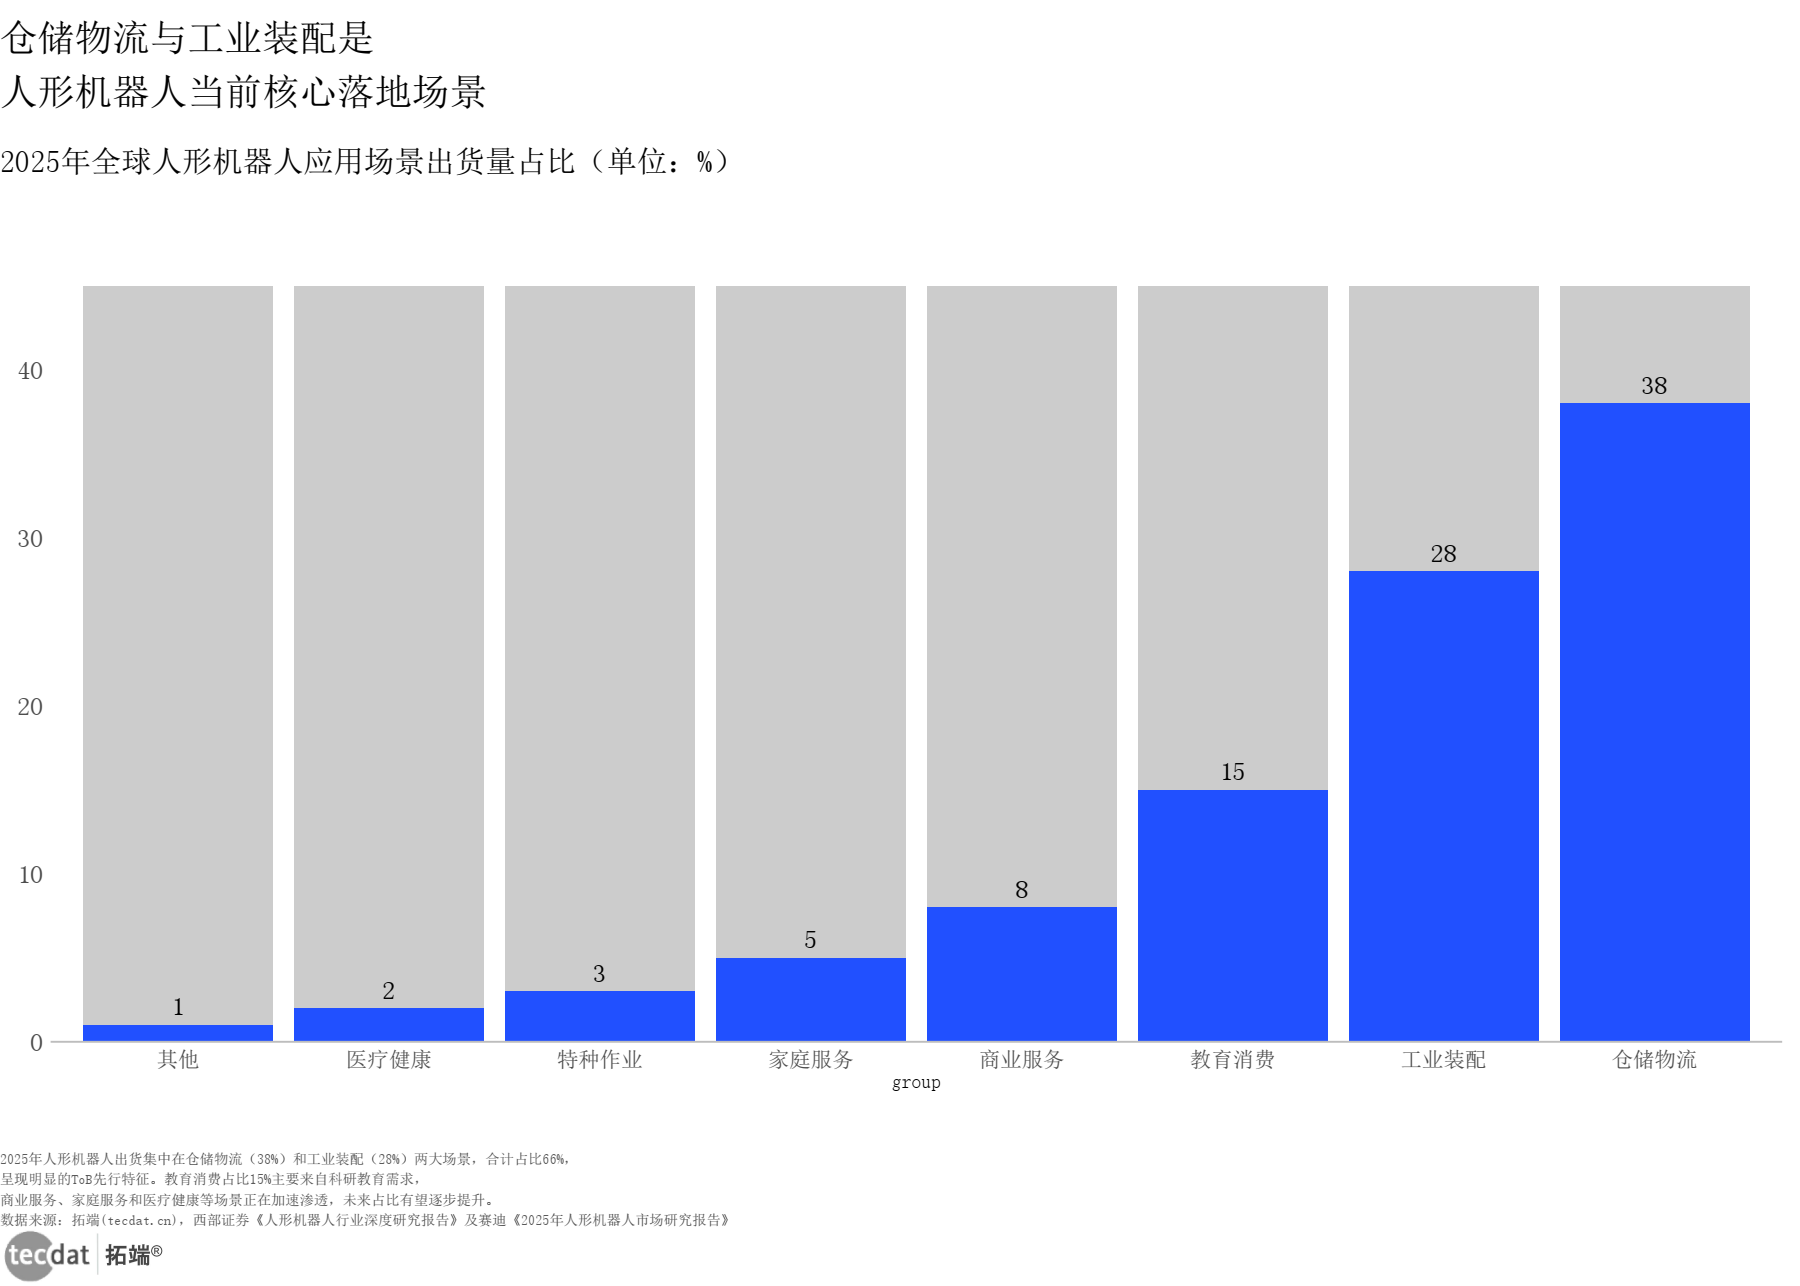
Figure 3: Shipment Scene Distribution – Horizontal Proportional Bar Chart (Data Chart 3)
From a global perspective: Asia-Pacific accounts for nearly 60% share, North America about 20%, and Europe about 15%. But the markets with the highest per-unit value are North America and Europe — where they sell “precision + brand premium,” while Asia-Pacific sells “volume + cost-effectiveness.” This means if Chinese enterprises’ overseas strategy doesn’t upgrade from “selling iron” to “selling solutions,” the profit margin ceiling will come sooner than expected.
Temperature differences between regional markets are also widening. Japan and South Korea’s competitive focus is on precision reducers and sensors, the United States is on AI algorithms and general large models, and the EU is on safety certification and standards formulation. China’s differentiated advantage is a “systematic approach” — four gears turning simultaneously: policy, supply chain, scenarios, and capital. But this is also a double-edged sword: if any one gear jams, the entire line will slow down.
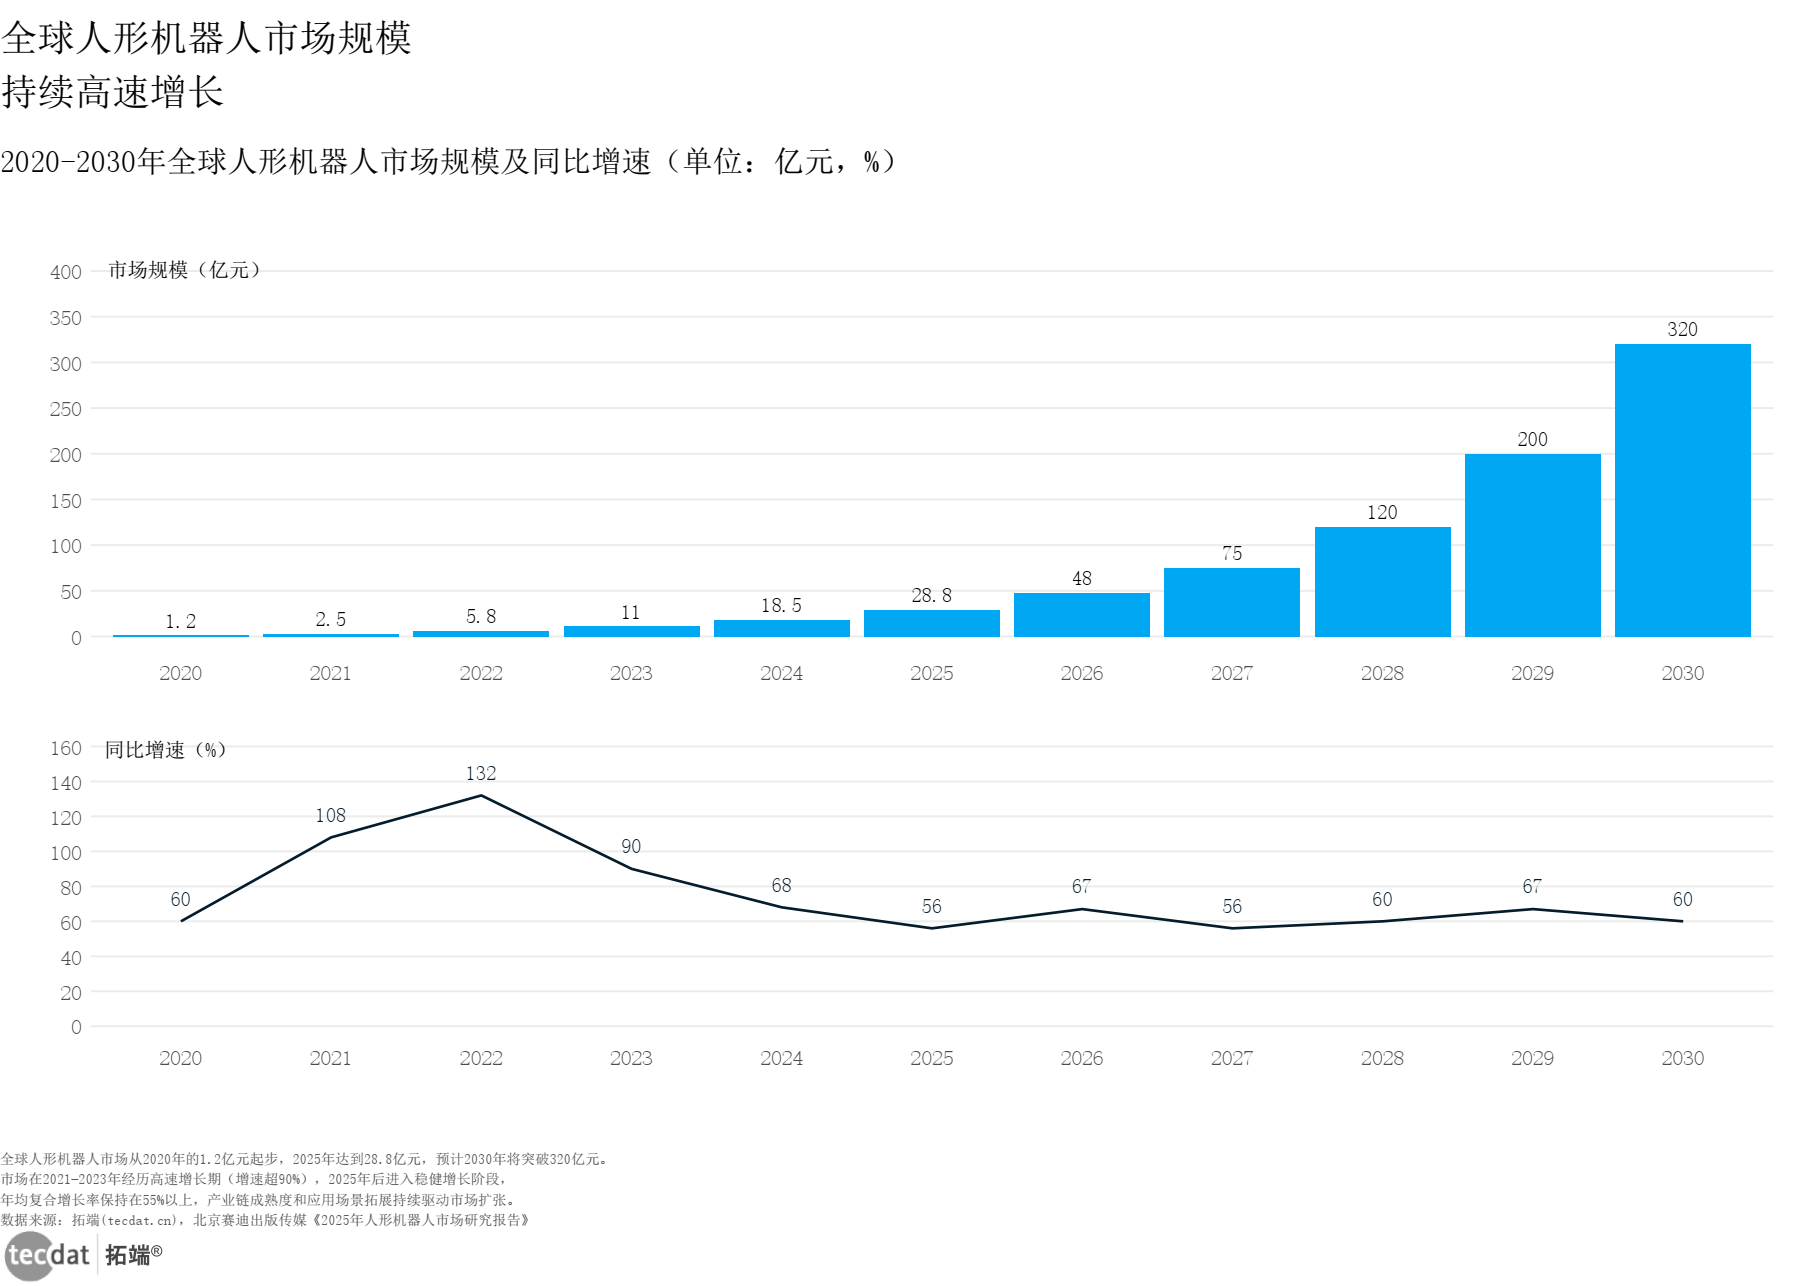
Figure 4: Global Market Regional Distribution – Grouped Bar Chart (Data Chart 4)
Chapter 3: Industrial Chain Investment Map: Value Highlands and Domestic Substitution Windows
Opening up the humanoid robot BOM table, three parts consume over 60% of the complete machine cost: reducers, servo motors, and controllers. And what are the localization rates for these three parts? Reducers below 30%, high-end servo motors below 40%, controllers about 50%. This is the clearest signal in the industrial chain investment map.
Upstream components not only have gross margins 15 to 25 percentage points higher than complete machines, but the competitive landscape is completely different: at the complete-machine level, hundreds compete for customers, while at the component level, three to five define the market. Complete-machine manufacturers have concentrated customers with strong bargaining power, but component technical barriers determine pricing power — in the reducer field, Japan’s Harmonic Drive alone accounts for over 40% of global market share, and domestic small factories face the same customer base, but the product precision gap is orders of magnitude.
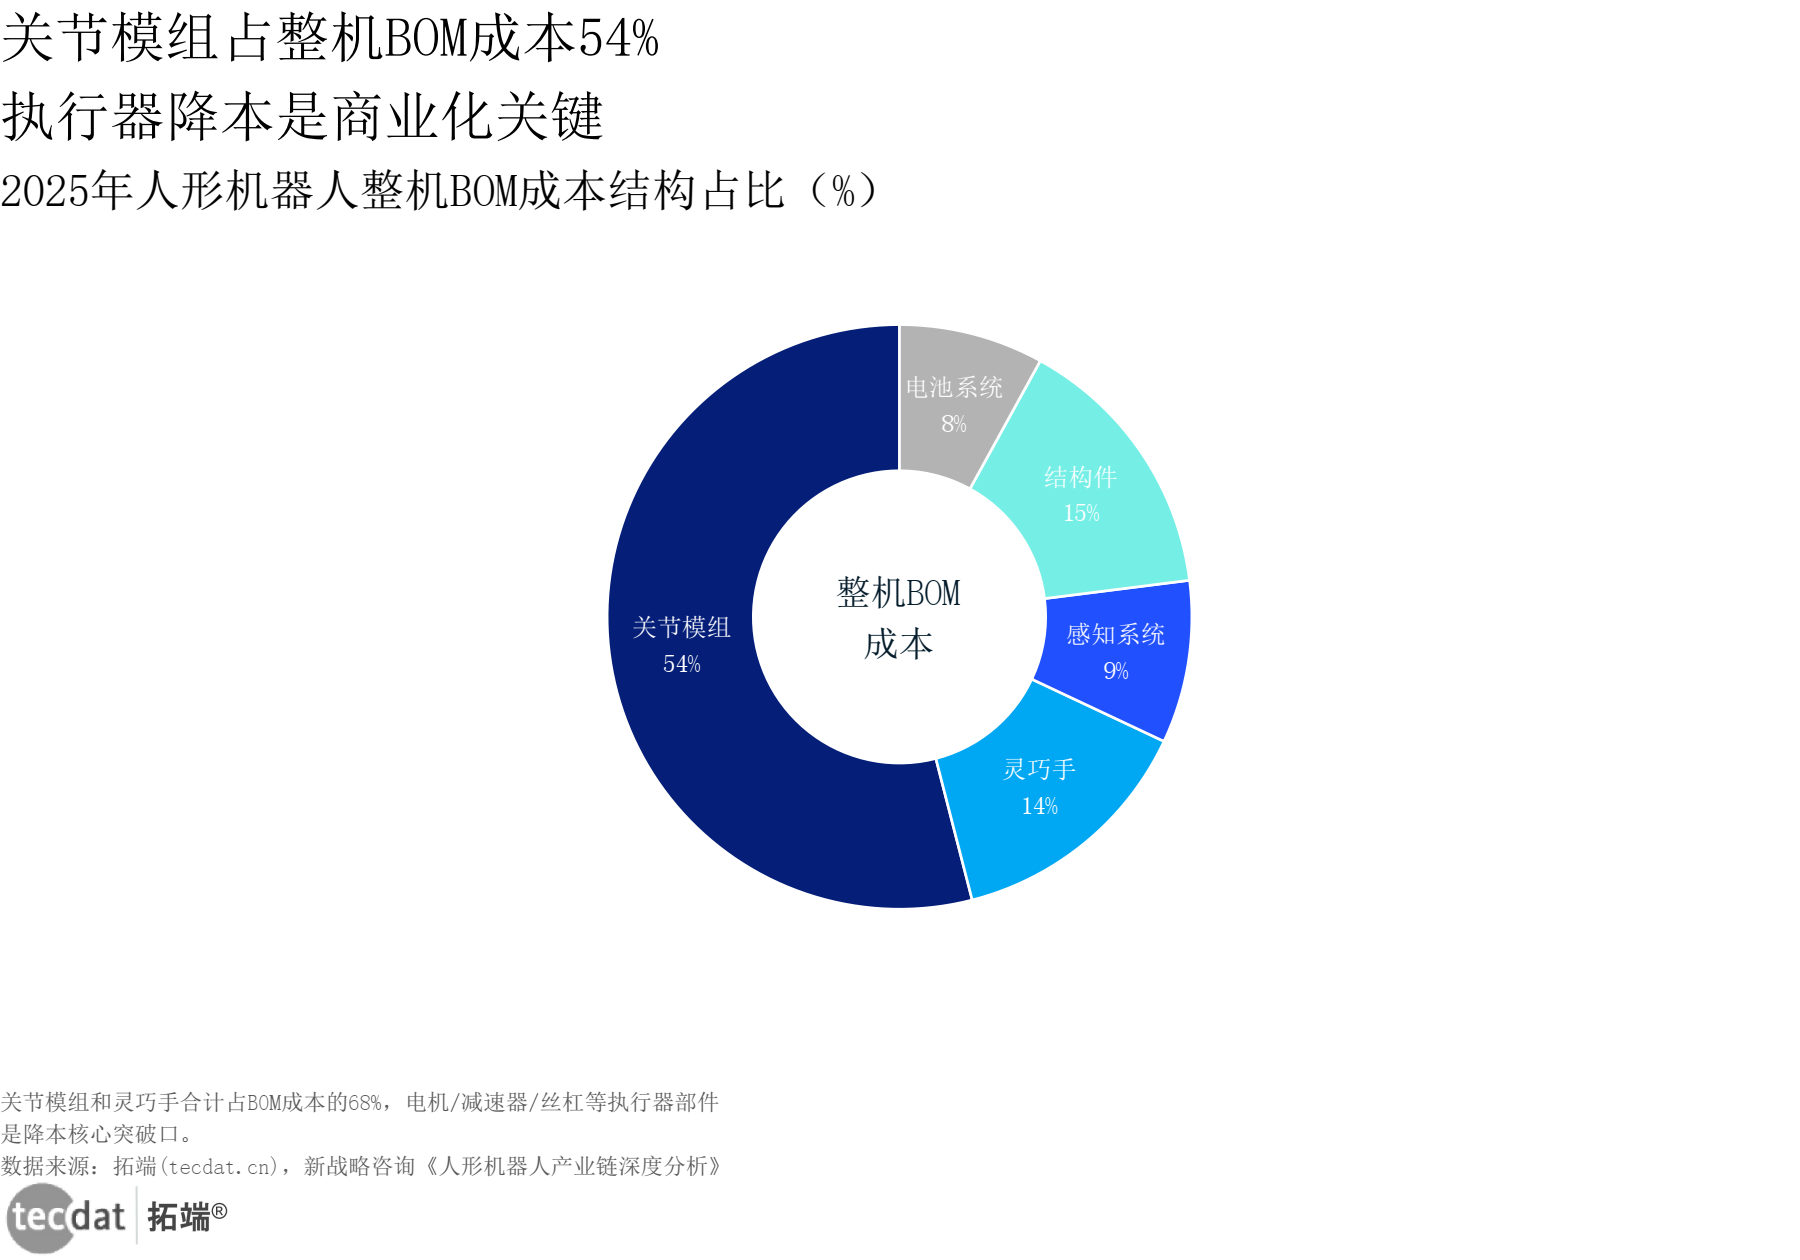
Figure 6: Industrial Chain Value Distribution – Bar Chart (Data Chart 5)
Domestic substitution of components is not achieved overnight. Japanese reducer accuracy and lifespan are two to three times that of domesticsimilar products — this is not laboratory data, but real results pulled from end customers running for 20,000 hours. German servo motor response speed leads domestic by one body length — it’s not a question of whether it can catch up, but that even if it catches up, power consumption doubles, which on battery-powered mobile platforms means being lame. The substitution path should be pragmatic: first move volume in mid-to-low-end scenarios with less demanding accuracy requirements, accumulate production line experience, build process databases, then attack high-end. The domestic substitution of automotive parts took fifteen full years; robotics components can be faster, but not fast enough to do in two to three years.
Domestic components have overtaken Japanese and German counterparts on the “cost-effectiveness” axis — products of the same accuracy have achieved 60-80% of the price. But on the three axes of “accuracy,” “lifespan,” and “stability,” the gap remains significant, and these three axes are precisely the most sensitive decision variables for industrial-grade customers. The loss from a single hour of production line downtime is enough to buy three additional imported reducers. So the critical threshold for domestic substitution is not “achieving the same quality,” but “good enough that customers are willing to switch” — between these two standards lies an entire production line verification cycle.
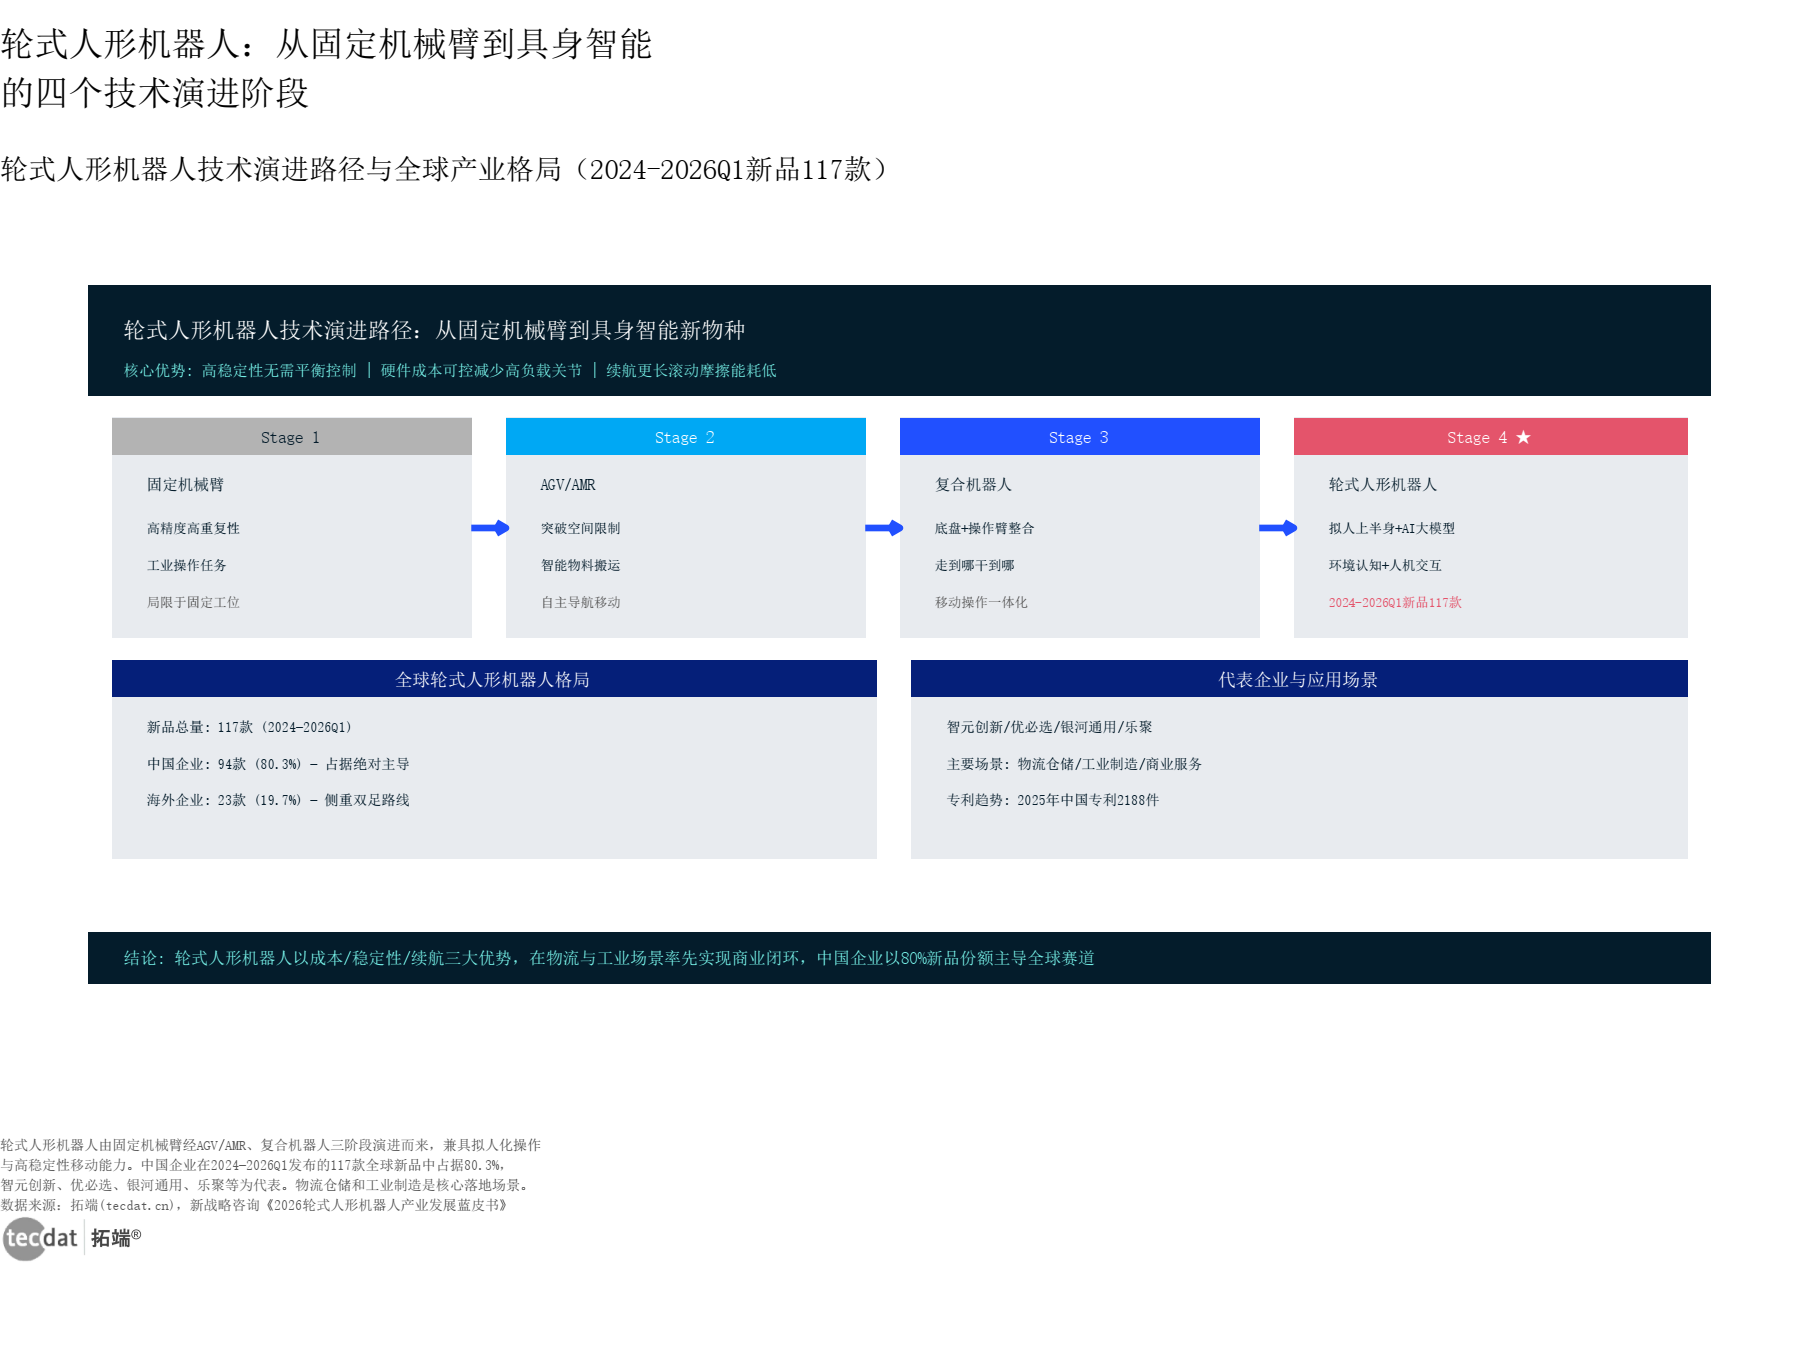
Figure 7: Technology Route Comparison Matrix – Radar Chart (Infographic 2)
Most Popular Insights
- Python Employee Data Turnover Prediction: ADASYN Sampling CatBoost Algorithm Analysis
- R Distributed Lag Nonlinear Model DLNM Analysis of Air Pollution and Health Data
- Python Ancient Artifacts Composition Analysis and Identification Research
- Python TensorFlow CNN Face Recognition System Construction
- Python Transformer Time Series Prediction Comparative Analysis
Chapter 4: Mass Production and Cross-Industry Integration: Automotive Supply Chain Model Being Replicated to Robotics Industry
2026 is regarded as the mass production year for humanoid robots. This judgment is not industry self-delusion.
Changan Automobile establishing Changan Robotics, Chery releasing the Mojia robot, Seres partnering with ByteDance, GAC-Xiaopeng-Perfect Day going all out — the collective cross-industry entry of automakers is a more convincing signal than any industry report figure. Incremental growth in the automotive industry has hit a ceiling, with China’s auto sales growth rate dropping back to single digits in 2025. Automakers need a new trillion-level imaginative space, and humanoid robots are structurally nothing more than a variant of “four wheels plus a torso.”
Automotive industry’s standardized production line management experience → transplanted to robot final assembly → supply chain vertical integration → steep cost curve decline. Tesla is already walking this path — Optimus’s joint motors share the same technical platform as Tesla automobile drive motors, and the welding robots on the production line and the humanoid robots to be assembled use the same motion control algorithm. Chinese automakers are just following along, and not slowly either.
But the term “mass production year” itself is the biggest risk source. In industry reports, “year one” means the trend has started. In investors’ minds, “year one” means volume release, profit release, doubling. But the industry’s pace won’t follow investors’ expectations. Automotive-grade component reliability verification — at least 12 months, production line worker training cycles — at least 6 months, supply chain deliveryintegration — at least 12 months. These three bottleneckscombined together, and the real capacity leap from thousands to tens of thousands of units requires at least 18 to 24 months, not the 6 months drawn on some companies’ PPTs.
The economies of scale from mass production are more significant at the component level than at the complete-machine level. When shipments leap from hundreds to thousands, the unit cost of reducers can drop by 30-40% — because three factors — mold amortization, bulk purchasing, and process optimization — act simultaneously at the component level. Meanwhile, the unit cost of complete-machine assembly drops by less than 10% — because assembly itself is a labor-intensive segment with weak economies of scale. So if you believe mass production will arrive, the thing you should most bet on is not complete-machine manufacturers, but those component suppliers who can earn “price” from “volume.”
Wheeled humanoid robots are a variant worth discussing separately. They are more stable than bipedal, more flexible than industrial robotic arms, and smarter than traditional AGVs. In scenarios such as warehousing logistics, inspection security, and commercial services, the commercialization certainty of wheeled solutions far exceeds that of bipedal ones. New Strategy Consulting’s blue book contains a set of data: the BOM cost of wheeled humanoid robots is approximately 60% of bipedal, but the covered application scenarios are about 80% of bipedal — this is an extremely cost-effective intermediate product.
Chapter 5: Core Component Breakdown: Motors, Ball Screws, Reducers — Three Highlands
Motors are the “muscles” of humanoid robots, ball screws are the “skeleton,” and reducers are the “joints.” The three have progressively increasing technical barriers: motor lowest, ball screw medium, reducer highest. Coincidentally, investment value follows the same order.
Motor domestic substitution is relatively the highest among the three, approaching 50%. Domestic servo motors have approached Japanese levels in core indicators such as power density and response speed. Leading domestic manufacturers like Inovance, HC Drive, and Delta have already had large-scale applications of their servo products in industrial robots. The gap mainly concentrates on two dimensions: miniaturization and thermal dissipation efficiency. Humanoid robot joints are extremely compact, with far higher demands on motor volume and heat generation than industrial scenarios — this is what domestic motors most need to make up for.
Ball screws are the hottest subdivision track in 2026. The technical threshold of planetary roller screws sits between motors and reducers, but the market growth expectation far exceeds both — most linear joints of humanoid robots adopt screw solutions, with each humanoid robot requiring 10 to 14 screws. Based on a 10,000-unit shipment calculation, just the screw item alone constitutes a 10-billion-yuan-level market.
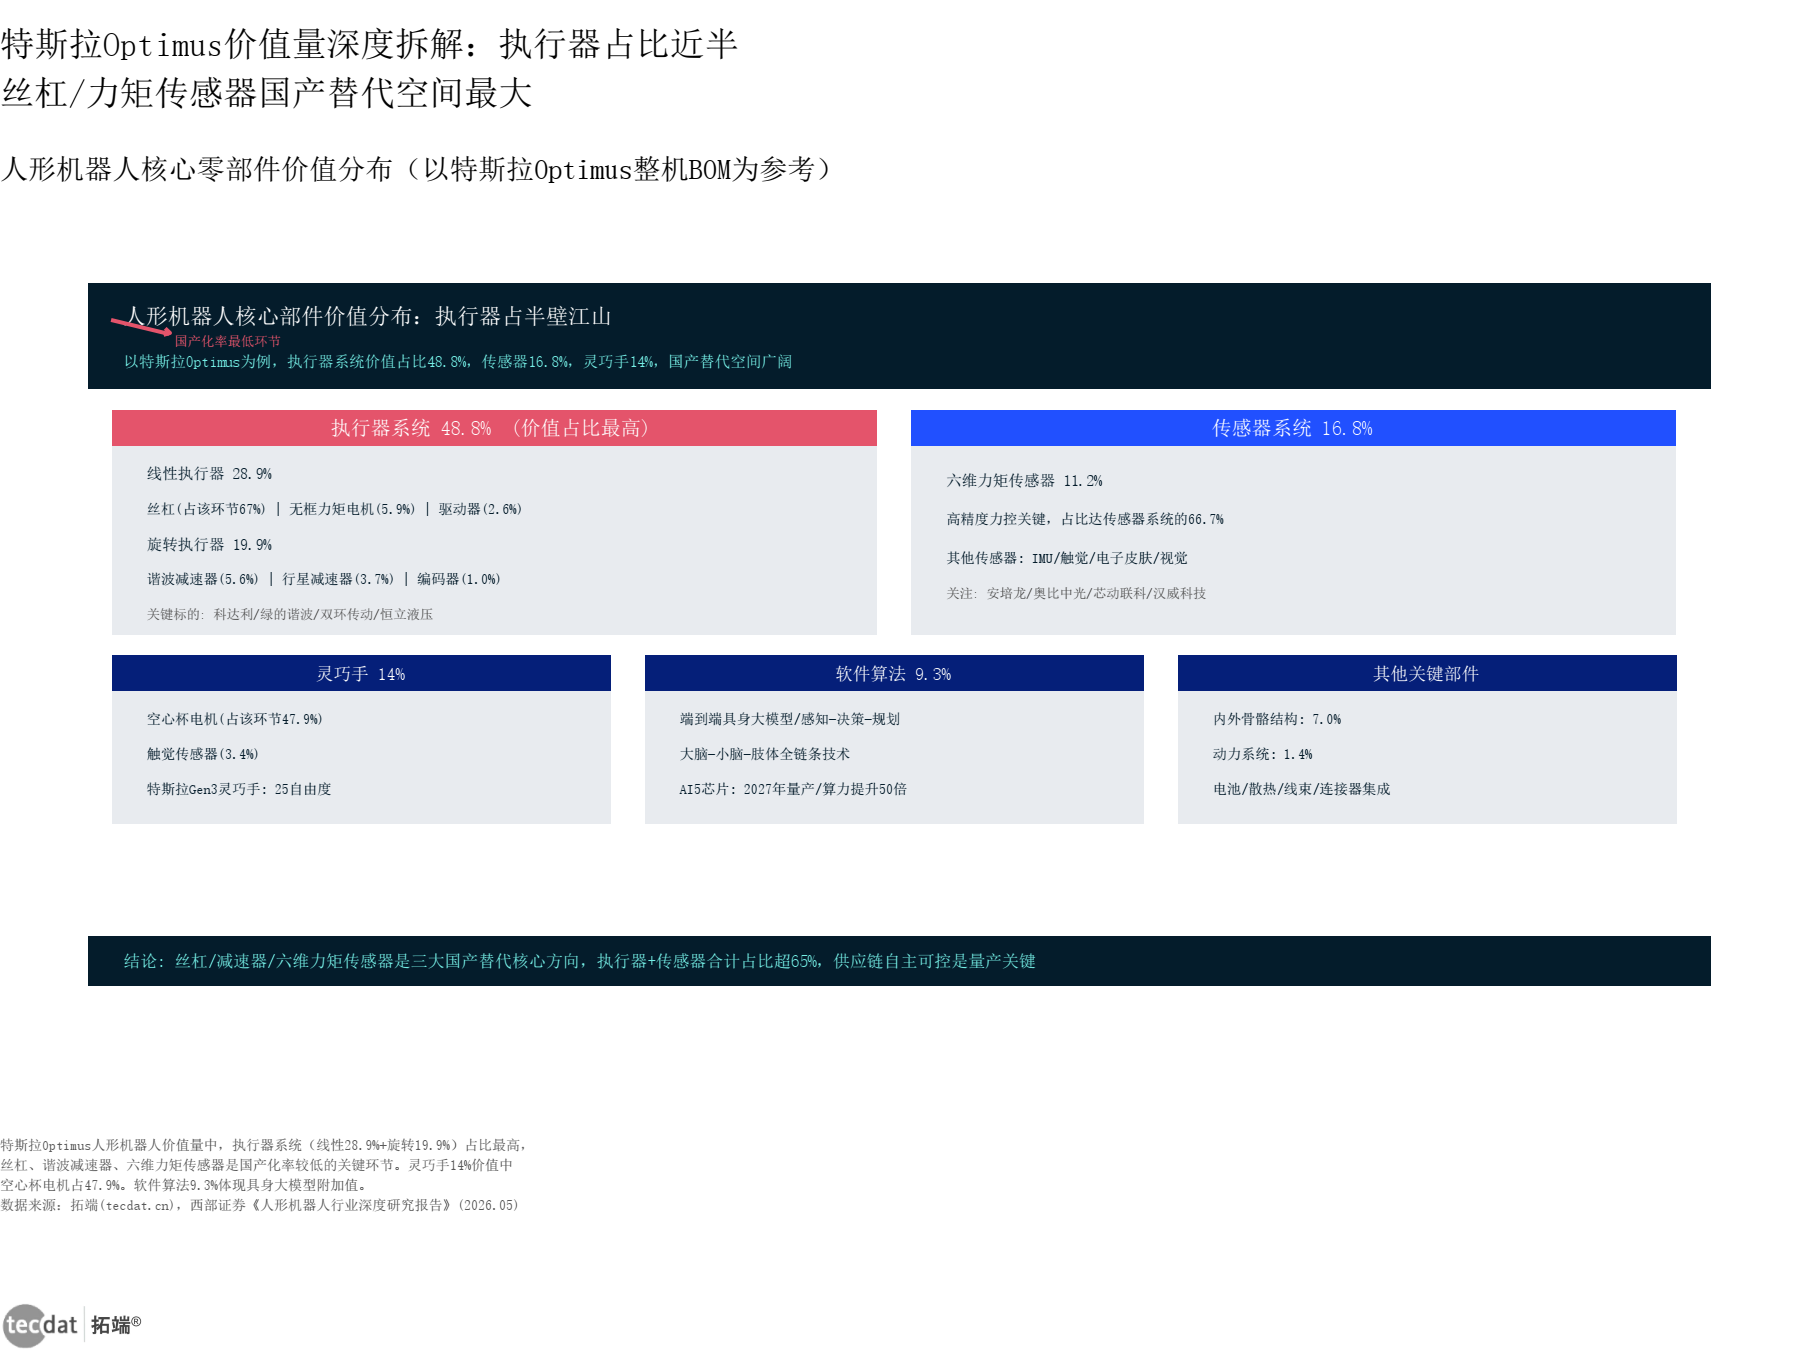
Figure 11: Core Component Technology Comparison – Matrix Chart (Infographic 4)
But the real barrier to ball screw manufacturing is not in design, but in process. The thread accuracy requirement for planetary roller screws reaches the micrometer level — heat treatment consistency, material batch stability, surface roughness control — these know-hows cannot be solved by simply throwing money at equipment. They require 5 to 10 years of production line experience accumulation and process database precipitation. This is precisely why the global high-end ball screw market has long been monopolized by a handful of enterprises such as Germany’s Schaeffler and Japan’s THK. Domestic enterprises have achieved breakthroughs in the ball screw field, with traditional precision manufacturing enterprises like Qinchuan Machine Tool and Hengli Hydraulic possessing the industrial foundation to enter. But between “can make” and “can stably mass-produce,” there remains a very wide process gap.
Reducers are the highest-barrier highland. Harmonic reducers and RV reducers together account for nearly 30% of humanoid robot joint costs. Japan’s Harmonic Drive holds over 40% market share in the harmonic reducer field. Domestic enterprises such as Green Harmonic and Laifue Harmonic have achieved mass production breakthroughs, but there remains a generational gap in accuracy lifespan and operational stability. A typical data point: Japanese harmonic reducer precision retention lifespan under rated load is approximately 20,000 hours, while domesticsimilar products are approximately 8,000 to 12,000 hours. For a factory running three shifts a day, this gap means more than double the downtime for part replacement frequency.
Dexterous hands are an easily overlooked but extremely critical segment. A humanoid robot’s dexterous hand contains 15 to 20 degrees of freedom, each degree being amicro actuator with technical complexity comparable to a joint. Drive methods (motor-driven vs. pneumatic-driven vs. shape memory alloy), perception schemes (tactile sensor arrays vs. visual feedback), transmission mechanisms (tendon-driven vs. linkage vs. gear) — the three technology routes have not yet converged. But whichever route ultimately wins, the demand for ball screws andmicro reducers will increase substantially. This is an upstream opportunity where “I make money no matter who wins.”
Chapter 6: Laparoscopic Robot Domestic Substitution: The Qualitative Leap from “Follower” to “Pacer”
Laparoscopic surgical robots are another golden track worth deep digging.
Intuitive Surgical’s da Vinci system has dominated this market for fully twenty years. But in 2024-2025, silent changes occurred. Domestic laparoscopic robots’ clinical data in urology and gynecology began approaching da Vinci levels, while procurement costs are only one-third to one-half of da Vinci’s. A set of da Vinci systems costs between 20 million and 30 million yuan, while domestic systems range between 8 million and 15 million yuan. For a county-level hospital performing several hundred surgeries per year, this price difference is thelife-and-death line between profitability and loss.
Domestic share jumped from less than 5% in 2022 to nearly 20% in 2025. This curve mirrors the domestic coronary stent substitution a decade ago — at that time, imported stents priced near 20,000 yuan, and after domestic stents hit the market, the price dropped to less than 10,000 yuan, completing import substitution within three years. Laparoscopic robots are replicating the same path,however the product complexity and clinical verification cycle are longer.
However, the competitive barrier for laparoscopic robots is not in hardware, but in ecology. da Vinci has accumulated over 12 million surgical cases globally, trained more than 60,000 surgeons, and established a complete training system from surgical simulators to course certification. This flywheel effect composed of installation volume, training networks, and surgical data is thetrue moat. For domestic laparoscopic robots to break through, they cannottake the “confronting top-tier hospitals head-on” routes, but shouldtake the “surrounding cities from the countryside” — first move volume at grassroots hospitals, accumulate surgical data, build reputation, then graduallypermeate top-tier hospitals.
In hardware parameters, domestic has caught up to or even surpassed da Vinci’sprevious generation products. Domestic manufacturers like Weigao, MicroPort, and Sijie have core indicators such as mechanical arm degrees of freedom, 3D visual clarity, and operational latency that are not inferior. But in terms of surgical volume, training systems, and consumables supply ecology, the gap still needs at least 3 to 5 years to fill.
An underestimated variable is policy. China’s tiered diagnosis and treatment policy is channeling surgical volume from top-tier hospitals to county-level hospitals, while county-level hospitals’ budget constraints naturally incline toward choosing more cost-effective domestic equipment. In 2025, over 100 county-level hospitals nationwide launched laparoscopic robot procurement assessments, with over 60% explicitly inclining toward domestic solutions. This is not technology-driven substitution, but business model and policy-forced substitution — andthis type of substitutionoften comes faster and fiercer than pure technology substitution.
Chapter 7: Global Competitive Landscape: China’s Approach Evolving from “Cost Advantage” to “Systemic Competitiveness”
The global battlefield is ablaze with competition. Tesla Optimus V3 enters factory training, Figure AI secures massive financing led by Microsoft and Nvidia, Boston Dynamics’ Atlas shifts from tech showcase to commercial landing, and 1X Technologies’ EVE series targets home service scenarios.
The competitive landscape is far more complex than surface busyness suggests. Chinese enterprises occupy the lower-right of the bubble chart with “large volume and wide coverage” — leading in shipments, but with relatively low per-unit value. US enterprises concentrate in the upper-left — small shipment volumes, but hightechnology premium. Japanese and German enterprises are “small but refined” — clinging to the fattiest components in the industrial chain, with profit margins and moats far higher than complete-machine manufacturers.
Notably, global competition is shifting from “single-machine performance” to “system capability.” Whoever can establish the shortest loop between data collection → model training → hardware iteration → scenario validation will buildtruebarrier. This is not a competition of a single robot, but a systemic competitioncombined with three flywheels: “data flywheel + supply chain flywheel + scenario flywheel.”
In 2025, multiple cities across China launched humanoid robot data acquisition center construction projects, with individual project investment scales at the hundred-million-yuan level. Data is becoming the new oil in the humanoid robot era — and China’srich manufacturing scenarios、diverse、comprehensive determines itsnatural advantage in “data reserves.”
Another dimension is patent competition. Global humanoid robot-related patent application volumes surged in 2024-2025, with Chinese enterprises’ application volume exceeding Japan and ranking only second to the United States. But incore patents — drive and control algorithms, precision reducer structural design, dexterous hand tactile perception — Japan and the US still dominate. The “quantity” of patents has caught up, but “quality” still needs time.
Chapter 8: Expected Difference Mining and Risk Panorama
We cross-validated ten reports and identified the three most mainstream expected differences in the market. Each corresponds to the space for excess returns.
The first expected difference: complete-machine shipment volume. The market universally expects global humanoid robot shipments to break through 100,000 units in 2028. But theactual slope of capacity ramp-up, the bottleneck cycle of supply chain yield, thehuge gap betweenend-user delivery and framework agreements — the cumulative effect of these resistances may cause theactual figure to be only half of expectations. This means complete-machine enterprises valued based on 100,000-unit shipment assumptions will face a round of value repricing.
The second expected difference: component value. The vast majority of market funds chase complete-machine targets, while component companies receive far less attention and valuation than complete machines. But component companies have superior profitability certainty — they don’t need tobet a technology route’s success or failure, they only need to achieve 80% of Japanese peers’ precision at 60% of the price, and orders becomecertainty. Moreover, component segments are closer to subsidies and farther from cyclicalvolatility. This pricing misalignment will not last long; when expectations at the complete-machine level begin to correct, funds will automatically flow toward the more certain component track.
The third expected difference: scenario landing sequence. The market is betting on home consumer grade — sweeping, cooking, companionship, education — these scenarios have the largestimaginative space, but the farthestcommercial deployment. Industrial logic points to industrial grade first — automotive manufacturing, warehousing logistics, inspection security — these scenarios haveclear ROI, standardizedworking environment, and clients willing to pay for efficiency. Whoever first understands the “scenario sequence” will lead by half aposition in the next round ofmarket.
Risk Panorama
Risk 1: Policy Subsidy Retreat
Risk Description: Local governments are currently providinghuge subsidies to the humanoid robot industry, with some enterprises deriving over 40% of revenue from subsidies or subsidy-related orders. Once subsidies retreat — this is an inevitable event — enterprisesrely on subsidies for survival will face cash flowbreak.
Impact Level: High.
Supplement and Response: Monitor special fund renewal announcements from local governments. When the first batch of three-year plans expire, the scale and direction of renewal funds will be the most direct indicator for judging policysustainability. In investment,prioritize choosing enterprises with subsidy revenueproportion below 15% that have already achieved positive operating cash flow. Join the exchange group to continuously track policy dynamics: tecdat_cn.
Risk 2: Technology Route Non-Convergence
Risk Description: Dexterous hand drive methods (motor/pneumatic/SMA), perception schemes (tactile/visualfusion), motion control architecture (model-driven/data-driven) — the three core technology routes have not yet converged. Enterprises maybet on the wrong direction, causingearly investment to becomesunk capital.
Impact Level: Medium-High.
Supplement and Response: Choose component suppliers laying out on multiple technology routes to reduce single-routebetting risk. Prioritize focusing on reducers and ball screws — “technology-neutral” links where these two core components remain indispensable regardless of howcomplete machine drive and control architectures evolve. Join the exchange group to obtain the latest technology route judgments.
Risk 3: Supply Chain Yield Ramp Below Expectations
Risk Description: Market expectations for humanoid robot shipments in 2026-2028 are built on the assumption of “smooth capacity ramp-up,” but production line yieldimprovement isalways non-linear. The accuracyconsistency of reducers, batchstability of ball screws, thermaluniformity of motors — the yieldimprovement at each of these three links is atough battle.
Impact Level: Medium.
Supplement and Response: Don’tlook at how many production lines an enterprisedraw,look at how many units itactual delivers each month. Framework agreements,intent orders, strategic cooperation memoranda — these don’t count. Only signed contracts, received deposits, and delivered orders count. Closely monitor enterprises’ quarterly shipment volume and yield data;once two consecutive quarters fall below expectations,decisively adjust positions.
Comparison Table: Core Viewpoints Across Multiple Reports
Data explanation: Different reports may havedeviation on the same metric due to differences in datameasurement criteria (including/excluding service robots), statistical timepoints (2024Q4 vs. 2025Q1), and regional scope (global/China). This table lists report publication times andmeasurement criteria explanations for cross-validation.
| Comparison Dimension | Report 1: Robotics Lecture Hall 2026 | Report 2: Humanoid Robot Deep Research | Report 3: HCR Huichen 2026 | Report 4: New Strategy Consulting Wheeled Blue Book | Comprehensive Judgment |
|---|---|---|---|---|---|
| 2026 Global Market Size | Approx. 8 billion USD | Approx. 8.2 billion USD | Approx. 7.8 billion USD | Not separately tracked | Around 8 billion USD,measurement criteria includes complete machines + core components |
| Number of Chinese Complete-Machine Enterprises | 140+ enterprises | Approx. 100 enterprises | 147 enterprises | Not tracked | Around 140 enterprises, approximately half are new entries established after 2023 |
| Component Localization Rate | 40-50% | Approx. 35% | Approx. 40% | Approx. 45% (wheeled-specific) | Reducers <30%, servo motors ~40%, controllers ~50% |
| Estimated Mass Production Inflection Point | 2026 | 2025-2026 | 2026 | 2026 (wheeled earlier) | 2026 is confirmed as mass production year, but 10,000-unit mass production earliest arrives in 2028 |
| Policy Support Intensity | Strong (Beijing-Shanghai-Shenzhen specials) | Strong | Very strong | Strong | Policy remains the strongest catalytic factor currently |
Action Checklist
Capability Level: Go deep on technical assessment of core components. Build an evaluation framework of 10 to 15 key indicators for reducer accuracy lifespan, ball screw heat treatmentconsistency, and motor thermal dissipation efficiency. Use this framework to measure every component company youlook atgood. Simultaneously,map out a complete supplier map for yoursubdivision track, marking the localization rate and substitution window for every link. Policy tracking cannot stop — policy changes in Beijing, Shanghai, and Shenzhen, special fund renewal announcements, subsidy retreat signals — thesethree categories information must be capturedin the first instance.
Mental Level: Conduct areverse deduction: if global humanoid robot shipments in 2028 are only half of expectations, what happens to my asset allocation? Who getshurt first, and who benefits? Pull out the domestic substitution of power batteries from ten years ago as abenchmark — how many years did CATL take to go from 10 billion to 100 billion in revenue? Mark every key node on this timeline, thentransfer it to today’s humanoid robot component track. Beware of narrative traps: framework agreements,intent orders, strategic cooperation — these three terms are everywhere in the industry, but between them andactual revenue recognition lies an entire product delivery chain.
Action Level: Step out of the office and into the factory. Visit ball screw heat treatment workshops, reducer machining centers, motor aging test lines — seeing production linestatus with your own eyes is more useful than reading a hundred industry reports.contrarian positioning components when the complete-machinesegment is overheating, bet on industrial grade ahead of everyone chasing consumer-grade stories. Re-review once every quarter — has the technology routestart converging? How much further has the domestic substitutionprogress bar advanced? Adjust positions dynamically based onthese signals; don’tlock in a single one note andimmobile.
Summary
1. 2026 is a certainwatershed. Policy, capital, technology, supply chain — these four forces resonate in 2026. This is not a year of linear growth, but an inflection point year of quantitative change leading to qualitative change. After thewatershed, the industry will shift from “a hundred flowers blooming” to “survival of the fittest,” with survivors not exceeding 20%.
2. Structural opportunities lie in components, not complete machines. The “Pareto distribution” pattern at the complete-machine level isfixed, with Zhiyuan and Unitree locking up 70% of market share. But domestic substitution at the component level has onlyjust begun to lift the curtain — reducers, ball screws, dexterous hands: these segments have low localization rates, high gross margins, anddeep technical barriers, making them the most certain investmentdirections over the next three years.
3. Laparoscopic robots are another “coronary stent moment.” Domestic laparoscopic surgical robots arereplicateing the domestic coronary stent substitutionmiracle bytake the “grassroots hospital coverage → accumulating surgical volume →feed back top-tier hospitals” countryside-surrounding-cities routes. This track’s certainty is higher than humanoid robot complete machines, but itsexplosion rhythm is slower and verificationcycle is longer — can’t be rushed, but cannot be ignored.
4. The biggest risk is not technology, it’s expectations. The market’sconsensus on 2028 shipment volume and penetration rate is overlyoptimistic. The slope of capacity ramp-up isoverestimated, the non-linear characteristics of production line yield are overlooked, thehuge gap between framework agreements andactual delivery is ignored. When expectationscorrect, the firstblade of valuation compressioncertainly cuts into the complete-machine level.
5. Three expected differences, threefold excess returns. Complete-machine shipments below expectations, component value severelyunderestimated, scenario landing sequence misjudged by the market — thecorrection process of these three expected differences is therealization process for the next three years’ excess returns. Whoever sees it first and acts fastest eats the fattiestsegment.
Get all report data at the end of the article, join the exchange group, add: tecdat_cn
Core Data Table Summary
| Metric | Value | Data Source |
|---|---|---|
| 2025 Global Humanoid Robot Shipments | Over 14,500 units | Omdia public data |
| 2025 Number of Chinese Complete-Machine Enterprises | Over 140 | State Council Information Office press conference / Robotics Frontier statistics |
| 2025 Embodied Intelligence Financing Events | 325 events | ITITJuzi statistics |
| 2025 Embodied Intelligence Financing Amount | 39.832 billion yuan | ITITJuzi statistics |
| YoY Financing Events Growth | 216% | ITITJuzi (2025 vs 2024) |
| YoY Financing Amount Growth | 326% | ITITJuzi (2025 vs 2024) |
| Billion-Yuan Valuation Humanoid Robot Unicorns | At least 6 | Robotics Frontier statistics |
| Enterprises Launching IPO Process | Over 30 | HKEX public information |
| Shenzhen Robot Component Localization Rate | Over 90% | Shenzhen Robotics Association |
| 2026 Global Market Size | Approx. 8 billion USD | Multiple industry reports comprehensive judgment |
| 2030 Global Market Size (Projection) | Over 240 billion yuan | Multiple reports cross-validation |
| Reducer Localization Rate | Below 30% | Multiple reports cross-validation |
| High-End Servo Motor Localization Rate | Approx. 40% | Multiple reports cross-validation |
| Controller Localization Rate | Approx. 50% | Multiple reports cross-validation |
| Top Two Enterprises Shipment Share | Approx. 75% | Omdia/public information |
| Scientific Research & Education Scene Shipment Share | Over 70% | Multiple reports comprehensive judgment |
Reference Report (PDF) Catalog for This Topic
- Robotics Lecture Hall: 2026 Embodied Intelligence and Humanoid Robot Industry Research Report
- Humanoid Robot Industry Deep Research Report: Humanoid Robots Are Inevitable, Downstream Applications Gradually Opening
- 2026 China Embodied Intelligence Industry Series Research Report – Humanoid Robot Chapter – HCR Huichen
- New Strategy Consulting: 2026 Wheeled Humanoid Robot Industry Development Blue Book
- Laparoscopic Surgical Robot Industry Deep Report: From Domestic Substitution to Global Competition, Laparoscopic Robot Industry Dual Breakthrough
- 2025 Deep Industry Analysis Report: Humanoid Robot Dexterous Hand Technology Route, Application Scenarios, and Key Industrial Chain Links Analysis Report
- Technical Barriers and Development Path: Humanoid Robot Core Components
- Source of Power · Motor System — Humanoid Robot Whole-Body Power Muscle and Energy Efficiency Core v4.0
- Robotics Industry Deep: Ball Screw Manufacturing Barriers Are High, Humanoid Robots Catalyze Ball Screw Market Size Leap
- Automotive Industry: Robot Mass Production Year, Overseas and Domestic Robot Co-development
And other 100+ selected AI computing industry reports have been shared to member group (join group to obtain complete catalog)
Article Chart List
Data Charts (10 total)
| No. | Chart Name | Chart Type |
|---|---|---|
| Figure 1 | Industry Development Stage and Policy Support Intensity | Quadrant Matrix |
| Figure 2 | Industrial Robot Installations | Dual-Axis Chart |
| Figure 3 | Shipment Scene Distribution | Horizontal Proportional Bar Chart |
| Figure 4 | Global Market Regional Distribution | Grouped Bar Chart |
| Figure 5 | Industrial Chain Value Distribution | Bar Chart |
| Figure 6 | Capacity Ramp Forecast | Line Chart |
| Figure 7 | Mass Production Cost Breakdown | Stacked Bar Chart |
| Figure 8 | Ball Screw Market Size Forecast | Area Chart |
| Figure 9 | Motor System Performance Comparison | Grouped Bar Chart |
| Figure 10 | Reducer Technology Route Comparison | Radar Chart |
Infographics (8 total)
- Infographic 1: Industrial Chain Panorama Structure Diagram (Multi-layer Ring Chart)
- Infographic 2: Technology Route Comparison Matrix (Radar Chart)
- Infographic 3: Cross-Industry Integration Roadmap (Flowchart)
- Infographic 4: Core Component Technology Comparison (Matrix Chart)
- Infographic 5: Laparoscopic Robot Market Share Changes (Stacked Area Chart)
- Infographic 6: Laparoscopic Robot Technology Benchmarking (Comparison Chart)
- Infographic 7: Global Competitive Landscape (Bubble Chart)
- Infographic 8: Global Policy Comparison (Heatmap)
Complete humanoid robot industry research report, code, data, and AI agents

Recommended
2026 Robotics Industry Frontier Insights Report: Humanoid and Special Robots, from Certification to Manufacturing to Consumption
Explore Insights每日分享最新报告和数据资料至会员群
关于会员群
- 本会员社群以垂直产业数据研究、深度行业报告分享、AI数据工具实操交流为核心定位;
- 入群即可解锁全行业数据内容免费阅读与下载权限,同步更新海内外一手优质研究报告文档与产业数据;
- 会员老用户享受专属 9 折续费优惠,可长期锁定社群全部权益;
- 为会员提供一对一免费 PDF 报告专属代找服务。
非常感谢您阅读本文,如需帮助请联系我们!
 2026 Humanoid Robots: From Technological Breakthroughs to Ecosystem Definition | 200+ Reports, Data and PPT Collection Download
 2026 AI Chip Industry Report: Supply & Demand, Domestic Substitution, Memory & Optical Chips | 100+ Report PDFs, Data & Visualization Templates Download
 2026具身智能产业研究报告:量产元年,资本与数据卡位战 | 附100+报告、数据合集
 2026 Brain-Computer Interface (BCI) Industry In-Depth Report: Market Size, Industry Chain, Clinical Progress, and Policy Empowerment