
95%置信区间限制非常接近此处的估计线,因为我们已经模拟了具有大样本量的数据集。
有时危险函数不会是恒定的,这将导致累积危险函数的梯度/斜率随时间变化。
可下载资源
危险率函数
让我们模拟R中的一些数据:
n < -  10000
h < -  0.5
t < -  -log(runif(n))/ h
该代码模拟了危险函数的存活时间,即常数。
event< -  1 *(t <5)
obstime< -  t
obstime [obstime> = 5] < -  5
现在让我们使用R中的生存包绘制估计的生存函数:
survfit < - survfit(Surv(obstime,event)~1)
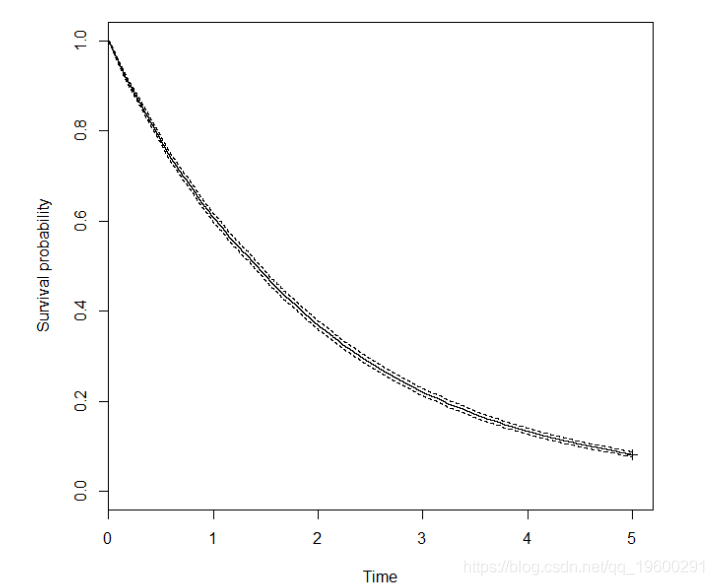

Kaplan-Meier
95%置信区间限制非常接近此处的估计线,因为我们已经模拟了具有大样本量的数据集。
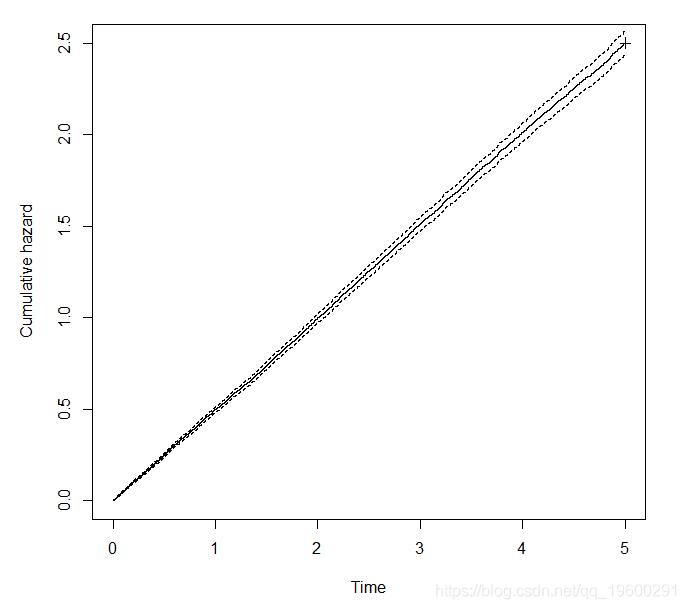
累积危险率函数
为了确定危险函数是否在变化,我们可以绘制累积危险函数,
plot(survfit,fun =“cumhaz”)

危险变化
有时危险函数不会是恒定的,这将导致累积危险函数的梯度/斜率随时间变化。
我们现在将再次模拟生存时间 :
highrisk < -  1 *(runif(n)<0.5)
h < -  0.5 + highrisk * 1.5
t < -  -log(runif(n))/ h

obstime [obstime> = 5] < -  5
我们再次绘制累积危险函数:
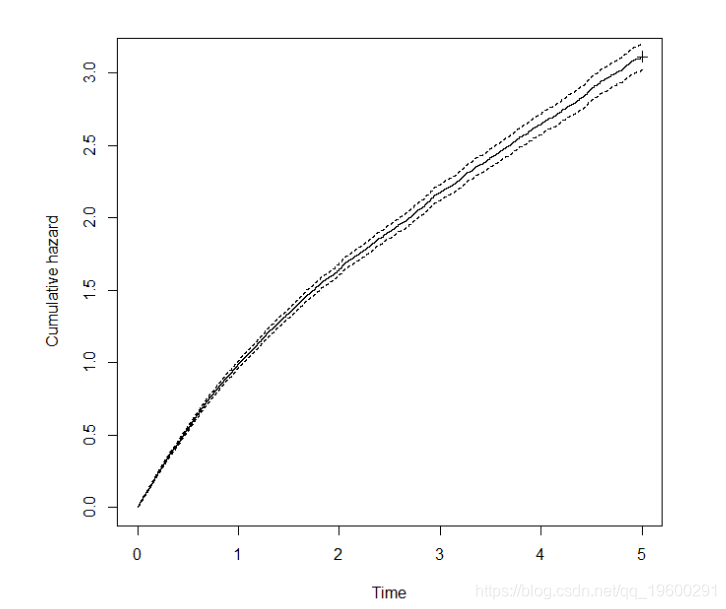

累积危险图,其中样本由50%低风险和50%高风险对象组成
该图的自然解释是受试者经历的危险随着时间的推移而减少,因为累积危险函数的梯度/斜率随时间降低。
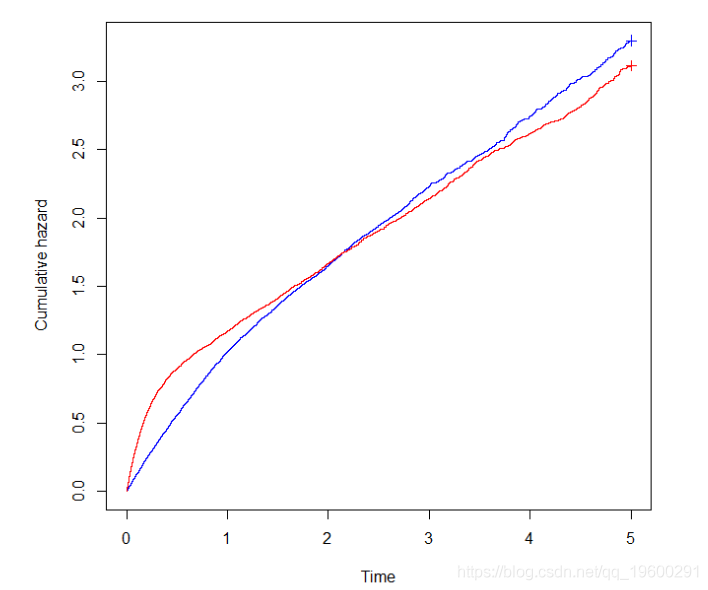
改变风险比
在我们比较两组生存率的研究中可能出现同样的问题,例如在比较两种治疗方案的随机试验中。这种比较通常通过估算两组之间的风险比来概括,假设两组的危害比率随着时间的推移是恒定的,使用Cox的比例风险模型。
highrisk < -  1 *(runif(n)<0.5)
治疗< -  1 *(runif(n)<0.5)
 t < -  -log(runif(n))/ h
事件< -  1 *(t <5)
时间< -  t
obstime [obstime> = 5] < -  5
现在让我们分别按治疗组绘制累积危险函数:
 R语言广义加性模型GAM、Tweedie分布的SaaS客户生命周期价值CLV预测研究——非线性关系捕捉与异方差性适配创新|附代码数据
 R语言优化沪深股票投资组合:粒子群优化算法PSO、重要性采样、均值-方差模型、梯度下降法|附代码数据
 视频讲解|Stata和R语言自助法Bootstrap结合GARCH对sp500收益率数据分析
 高维变量选择专题|R、Python用HOLP、Lasso、SCAD、PCR、ElasticNet实例合集分析企业财务、糖尿病、基因数据


