下面显示了四种预测时间序列的方法。
支持向量机(R package e1071。“Chih-Chung Chang and Chih-Jen Lin,LIBSVM:a library for support vector machines,2005.”的实现)。
递归分区(R package rpart。“Breiman,Friedman,Olshen and Stone。Classification and Regression Trees,1984”的实现)。
将最后两种方法的性能与rle进行比较,得到svm的95%和rpart的94%。
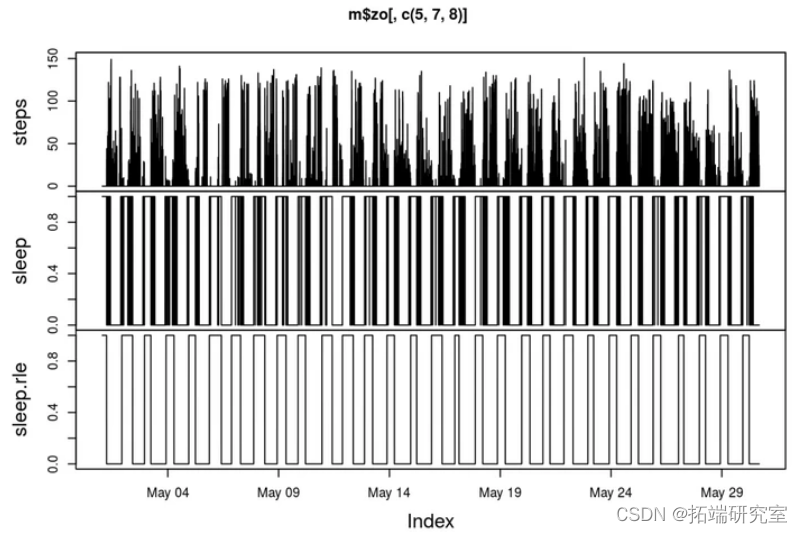
# Apply rle (forward and backward) and a condition: lenght time for sleep changes of 1h m$rle(Xvar ='sleep',Xlmin =60)m$setZoo()# Show differences between conditional and conditional + rleplot(m$zo[,c(5,7,8)],type ='l')
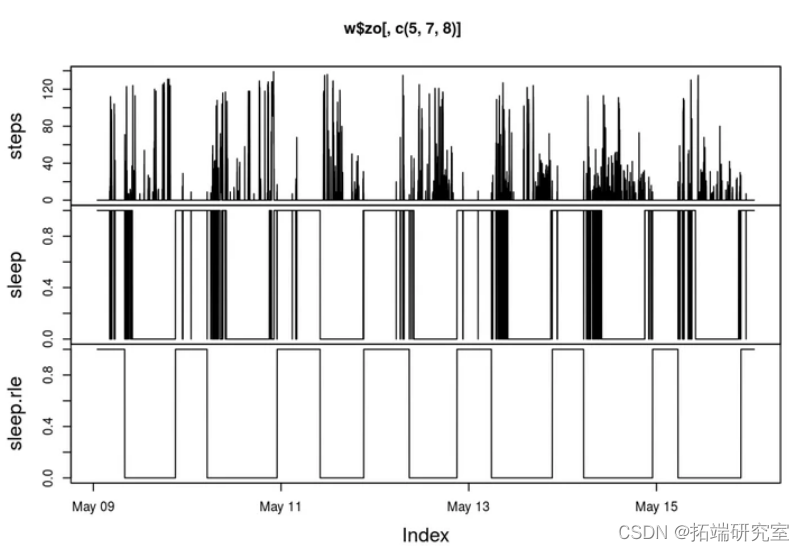
# Subset a week
# Plot correlation matrix

w$correlation(Xvars =w$nm[c(2:7,9)])

# SVM and Recursive partitioning

plot(tune.gamma.cost)

rpart.p <- predict(rpart.m, data[,-1],type ='class')# Resultsdt$svm = as.integer(svm.p)dt$rpart = as.integer(rpart.p)plot(w$dt2zoo(dt)[,c(5,8,9,10)],type ='l')

可下载资源
关于作者
Kaizong Ye是拓端研究室(TRL)的研究员。在此对他对本文所作的贡献表示诚挚感谢,他在上海财经大学完成了统计学专业的硕士学位,专注人工智能领域。擅长Python.Matlab仿真、视觉处理、神经网络、数据分析。
本文借鉴了作者最近为《R语言数据分析挖掘必知必会 》课堂做的准备。
非常感谢您阅读本文,如需帮助请联系我们!
 Python多尺度加权GOPAE-SVM-RF-GBT融合模型的高速列车轴承振动数据故障诊断与迁移学习可解释性分析|附代码数据
 R语言广义加性模型GAM、Tweedie分布的SaaS客户生命周期价值CLV预测研究——非线性关系捕捉与异方差性适配创新|附代码数据
 R语言优化沪深股票投资组合:粒子群优化算法PSO、重要性采样、均值-方差模型、梯度下降法|附代码数据
 Python用Ridge、Lasso、KNN、SVM、决策树、随机森林、XGBoost共享单车数据集需求预测及动态资源调配策略优化|附代码数据


