在我今天参与的一个讨论中,提出了一个问题,即在具有单个连续预测器的线性回归模型中R平方如何/是否取决于预测变量的方差。这个问题的答案当然是肯定的。
可视化
我们还可以在R中轻松地可视化前面的概念。我们首先从具有非常大的样本大小的线性模型中模拟数据:
n < -  10000
 x < -  100 * runif(n)
y < -  x + rnorm(n)
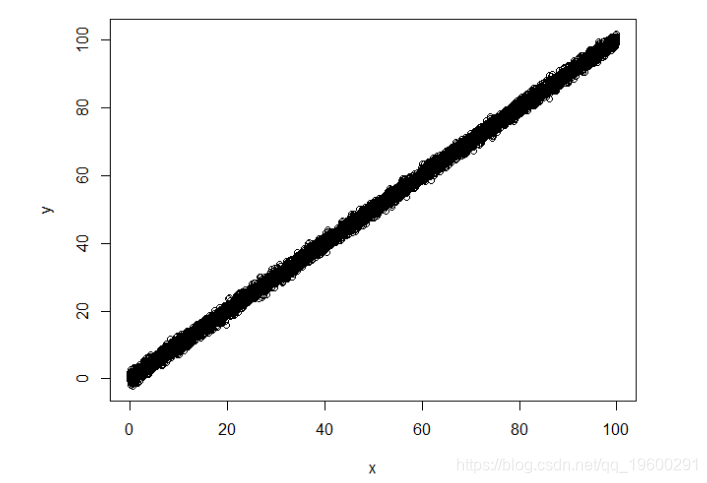

我们有: Y对X,对X没有限制
拟合相应的线性模型证实了这一点:
summary(lm(y~x))

Call:
lm(formula = y ~ x)

Residuals:
    Min      1Q  Median      3Q     Max
-4.1295 -0.6794 -0.0023  0.6879  3.5579

Coefficients:
             Estimate Std. Error  t value Pr(>|t|)
(Intercept) 0.0068489  0.0204500    0.335    0.738
x           0.9999752  0.0003534 2829.539   <2e-16 ***
---
Signif. codes:  0 ‘***’ 0.001 ‘**’ 0.01 ‘*’ 0.05 ‘.’ 0.1 ‘ ’ 1

Residual standard error: 1.015 on 9998 degrees of freedom
Multiple R-squared:  0.9988,	Adjusted R-squared:  0.9988
F-statistic: 8.006e+06 on 1 and 9998 DF,  p-value: < 2.2e-16

给出R平方0.9988。
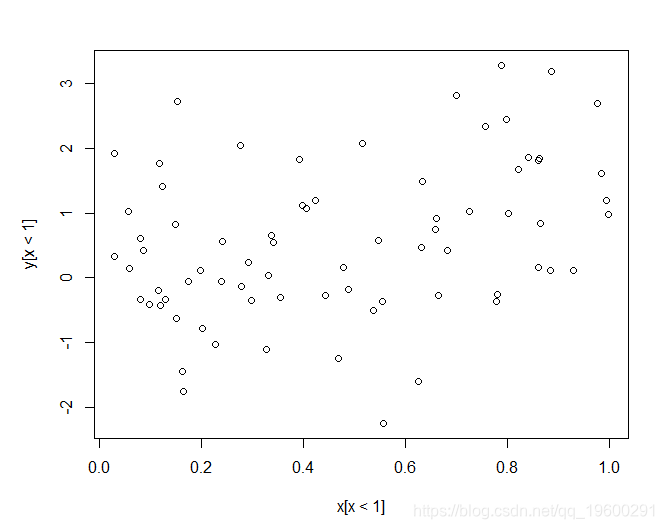

接下来,我们再次绘制数据,
summary(lm(y[x<1]~x[x<1]))

Call:
lm(formula = y[x < 1] ~ x[x < 1])

Residuals:
     Min       1Q   Median       3Q      Max
-2.93421 -0.73513 -0.09459  0.69282  2.59506

Coefficients:
            Estimate Std. Error t value Pr(>|t|)
(Intercept)  -0.0893     0.2432  -0.367  0.71459
x[x < 1]      1.3960     0.4386   3.183  0.00215 **
---
Signif. codes:  0 ‘***’ 0.001 ‘**’ 0.01 ‘*’ 0.05 ‘.’ 0.1 ‘ ’ 1

Residual standard error: 1.121 on 72 degrees of freedom
Multiple R-squared:  0.1233,	Adjusted R-squared:  0.1112
F-statistic: 10.13 on 1 and 72 DF,  p-value: 0.002155
R平方值低得多,为0.1233。
非常感谢您阅读本文,有任何问题请在下面留言!
1
1
关于作者
Kaizong Ye是拓端研究室(TRL)的研究员。
本文借鉴了作者最近为《R语言数据分析挖掘必知必会 》课堂做的准备。


