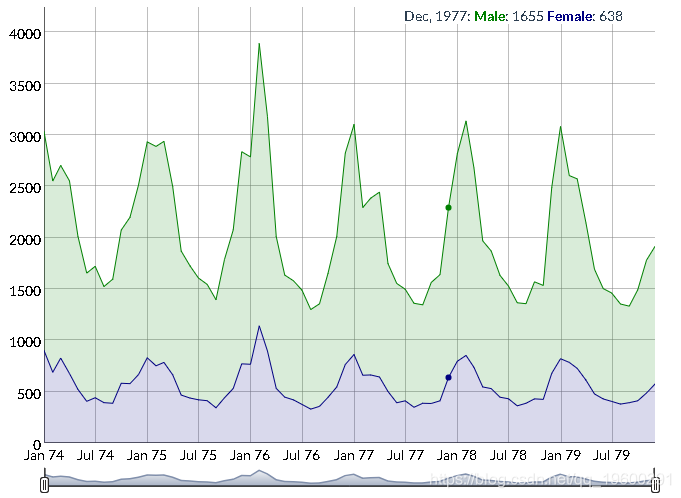
dygraph(lungDeaths) %>%
  dySeries("mdeaths", label = "Male") %>%
  dySeries("fdeaths", label = "Female") %>%
  dyOptions(stackedGraph = TRUE) %>%
  dyRangeSelector(height = 20)

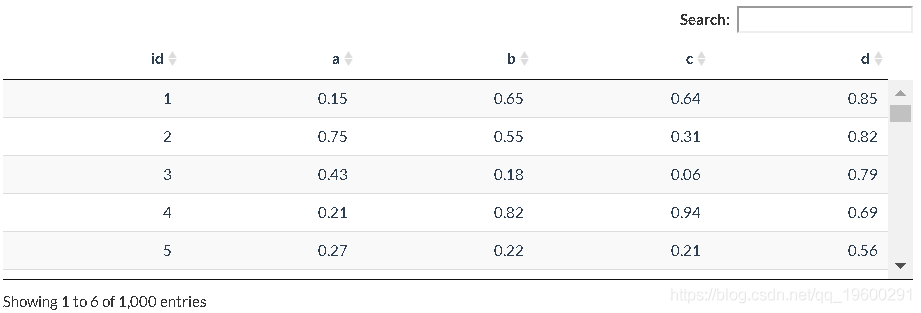
DT::datatable(m, , extensions = "Scroller", options = list(dom = "frtiS", scrollY = 200,
    scrollCollapse = TRUE))
可下载资源
关于作者
Kaizong Ye是拓端研究室(TRL)的研究员。在此对他对本文所作的贡献表示诚挚感谢,他在上海财经大学完成了统计学专业的硕士学位,专注人工智能领域。擅长Python.Matlab仿真、视觉处理、神经网络、数据分析。
本文借鉴了作者最近为《R语言数据分析挖掘必知必会 》课堂做的准备。
非常感谢您阅读本文,如需帮助请联系我们!
 R语言广义加性模型GAM、Tweedie分布的SaaS客户生命周期价值CLV预测研究——非线性关系捕捉与异方差性适配创新|附代码数据
 R语言优化沪深股票投资组合:粒子群优化算法PSO、重要性采样、均值-方差模型、梯度下降法|附代码数据
 视频讲解|Stata和R语言自助法Bootstrap结合GARCH对sp500收益率数据分析
 高维变量选择专题|R、Python用HOLP、Lasso、SCAD、PCR、ElasticNet实例合集分析企业财务、糖尿病、基因数据


