
在这里,我将讨论哪些函数可用于处理正态分布:dnorm,pnorm,qnorm和rnorm。
概率密度函数(PDF,简称:密度)表示观察具有特定值的测量值的概率,因此密度上的积分始终为1。
可下载资源
R中的分布函数
有四个关联的函数, 四个正态分布函数是:
- d范数:正态分布的密度函数
- p范数:正态分布的累积密度函数
- q范数:正态分布的分位数函数
- r范数:从正态分布中随机抽样
概率密度函数:dnorm
概率密度函数(PDF,简称:密度)表示观察具有特定值的测量值的概率,因此密度上的积分始终为1。 XX,正常密度定义为
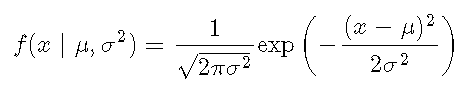

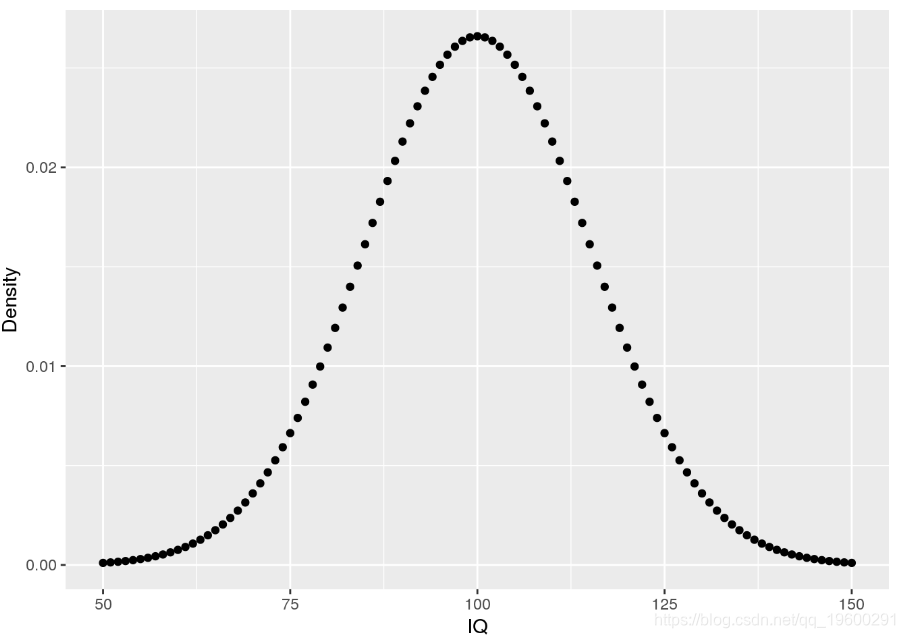
使用密度,可以确定事件的概率。例如,您可能想知道:一个人的IQ恰好为140的可能性是多少?。在这种情况下,您将需要检索IQ分布在值140处的密度。可以用100的平均值和15的标准差对IQ分布进行建模。相应的密度为:
sample.range <- 50:150
iq.mean <- 100
iq.sd <- 15
iq.dist <- dnorm(sample.range, mean = iq.mean, sd = iq.sd)
iq.df <- data.frame("IQ" = sample.range, "Density" = iq.dist)
library(ggplot2)
ggplot(iq.df, aes(x = IQ, y = Density)) + geom_point()

通过这些数据,我们现在可以回答初始问题以及其他问题:
# likelihood of IQ == 140?
pp(iq.df$Density[iq.df$IQ == 140])
## [1] "0.076%"# likelihood of IQ >= 140?

## [1] "0.384%"# likelihood of 50 < IQ <= 90?
## [1] "26.284%"累积密度函数:pnorm
累积密度(CDF)函数是单调增加的函数,因为它通过
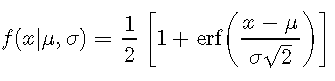

为了直观了解CDF,让我们为IQ数据创建一个图:
ggplot(iq.df, aes(x = IQ, y = CDF_LowerTail)) + geom_point()
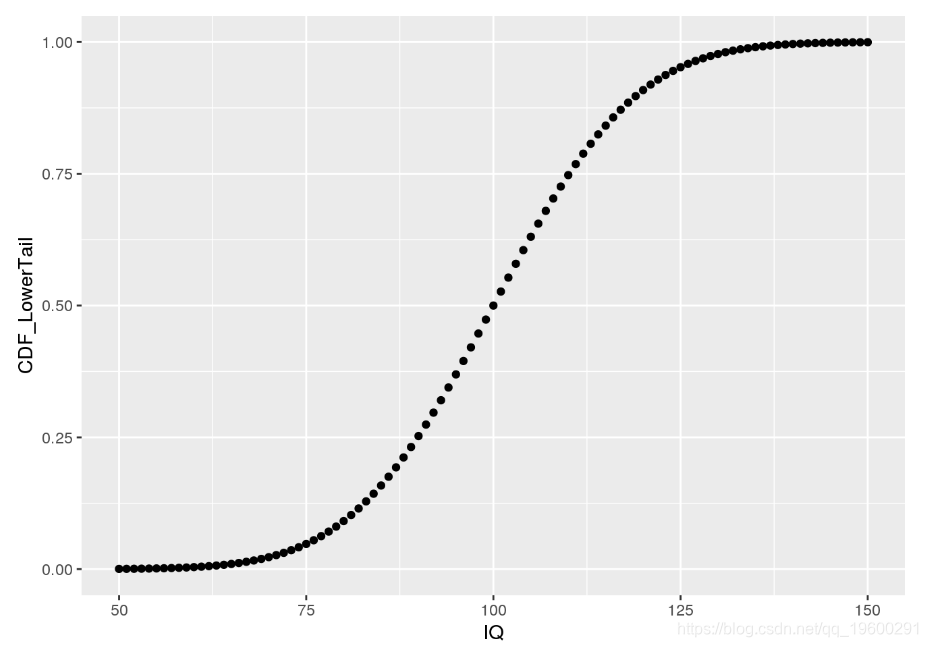

如我们所见,所描绘的CDF显示了IQ小于或等于给定值的可能性。这是因为pnorm默认情况下计算低尾巴,即P[ X< = x ]P[X<=X]。利用这些知识,我们可以以略有不同的方式获得一些先前问题的答案:
# likelihood of 50 < IQ <= 90?
## [1] "25.249%"# set lower.tail to FALSE to obtain P[X >= x]
# Probability for IQ >= 140? same value as before using dnorm!

## [1] "0.383%"请注意,pnorm的结果与手动汇总通过dnorm所获得的概率所得的结果相同。此外,通过设置lower.tail = FALSE,dnorm可用于直接计算p值,该p值用于衡量观察值的可能性至少与获得的值一样高。
分位数功能:qnorm
分位数函数只是累积密度函数(iCDF)的反函数。因此,分位数函数从概率映射到值。让我们看一下分位数函数P[ X< = x ]P[X<=X]:
# input to qnorm is a vector of probabilities

ggplot(icdf.df, aes(x = Probability, y = IQ)) + geom_point()
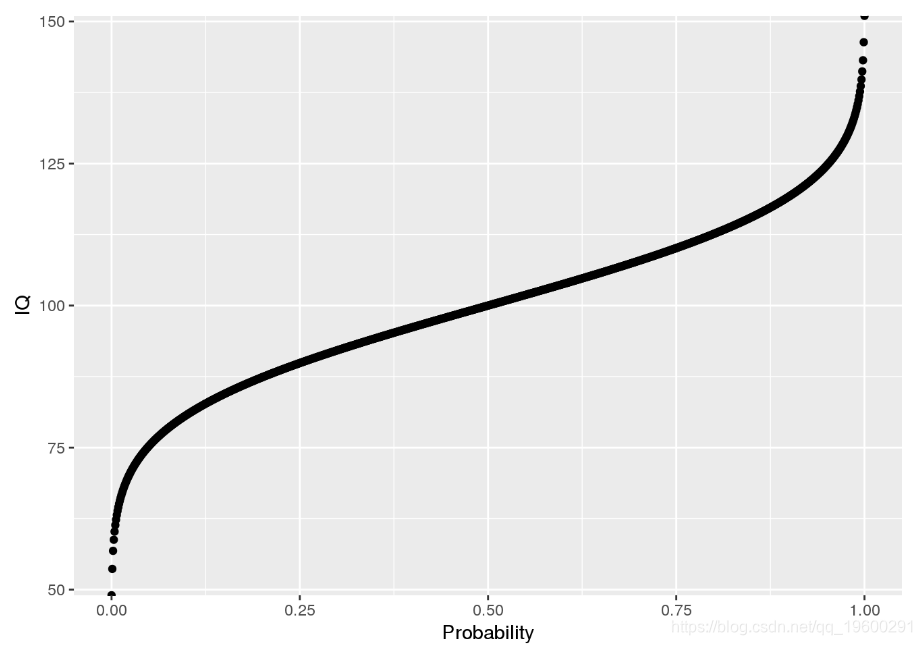

使用分位数函数,我们可以回答与分位数有关的问题:
# what is the 25th IQ percentile?

## [1] 89.88265# what is the 75 IQ percentile?

## [1] 110.1173# note: this is the same results as from the quantile function

##        0%       25%       50%       75%      100%
##      -Inf  89.88265 100.00000 110.11735       Inf
随机采样函数:rnorm
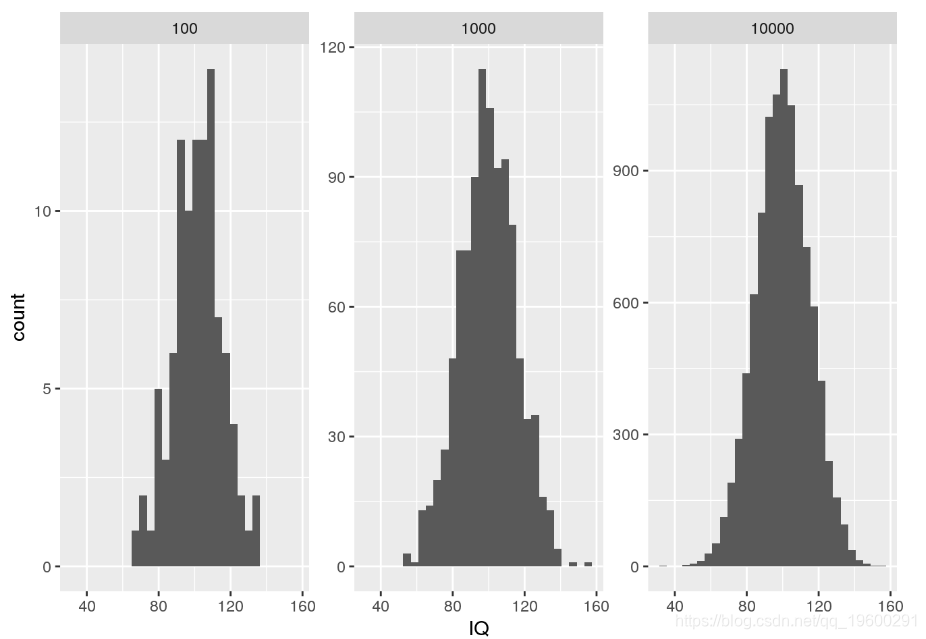
当您想从正态分布中抽取随机样本时,可以使用rnorm。例如,我们可以rnorm用来模拟IQ分布中的随机样本。
# show one facet per random sample of a given size
ggplot() + geom_histogram(data = my.df, aes(x = IQ)) + facet_wrap(.~SampleSize, scales = "free_y")

ggplot(my.sample.df, aes(x = IQ)) + geom_histogram()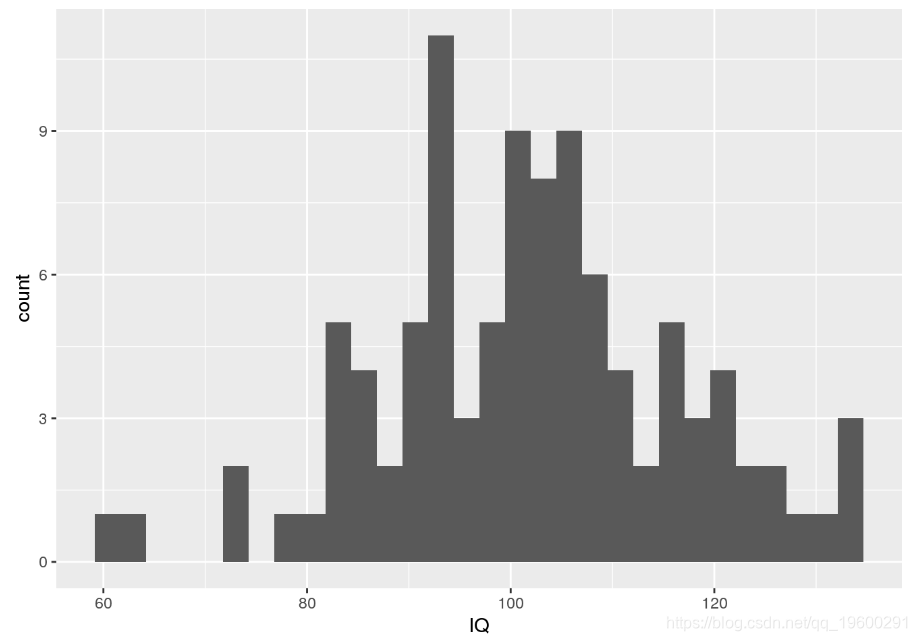
请注意,我们进行调用set.seed是为了确保随机数生成器始终生成相同的数字序列以实现可重复性。
可下载资源
关于作者
Kaizong Ye是拓端研究室(TRL)的研究员。在此对他对本文所作的贡献表示诚挚感谢,他在上海财经大学完成了统计学专业的硕士学位,专注人工智能领域。擅长Python.Matlab仿真、视觉处理、神经网络、数据分析。
本文借鉴了作者最近为《R语言数据分析挖掘必知必会 》课堂做的准备。
非常感谢您阅读本文,如需帮助请联系我们!
 R语言广义加性模型GAM、Tweedie分布的SaaS客户生命周期价值CLV预测研究——非线性关系捕捉与异方差性适配创新|附代码数据
 R语言优化沪深股票投资组合:粒子群优化算法PSO、重要性采样、均值-方差模型、梯度下降法|附代码数据
 视频讲解|Stata和R语言自助法Bootstrap结合GARCH对sp500收益率数据分析


