
本文并不表示R在数据分析方面比Python更好或更快速,我本人每天都使用两种语言。这篇文章只是提供了比较这两种语言的机会。
CSV文件包含纽约市的311条投诉。它是纽约市开放数据门户网站中最受欢迎的数据集。
可下载资源
介绍
本文中的 数据 每天都会更新,我的文件版本更大,为4.63 GB。
数据工作流程
install.packages("devtools")
library("devtools")
install_github("ropensci/plotly")
library(plotly)需要创建一个帐户以连接到plotly API。或者,可以只使用默认的ggplot2图形。
set_credentials_file("DemoAccount", "lr1c37zw81") ## Replace contents with your API Key使用dplyr在R中进行分析
假设已安装sqlite3(因此可通过终端访问)。
$ sqlite3 data.db # Create your database
$.databases       # Show databases to make sure it works
$.mode csv
$.import <filename> <tablename>
# Where filename is the name of the csv & tablename is the name of the new database table
$.quit
将数据加载到内存中。
library(readr)
# data.table, selecting a subset of columns
time_data.table <- system.time(fread('/users/ryankelly/NYC_data.csv',
                   select = c('Agency', 'Created Date','Closed Date', 'Complaint Type', 'Descriptor', 'City'),
                   showProgress = T))
kable(data.frame(rbind(time_data.table, time_data.table_full, time_readr)))| user.self | sys.self | elapsed | user.child | sys.child | |
|---|---|---|---|---|---|
| time_data.table | 63.588 | 1.952 | 65.633 | 0 | 0 |
| time_data.table_full | 205.571 | 3.124 | 208.880 | 0 | 0 |
| time_readr | 277.720 | 5.018 | 283.029 | 0 | 0 |
我将使用data.table读取数据。该 fread 函数大大提高了读取速度。
关于dplyr
默认情况下,dplyr查询只会从数据库中提取前10行。
library(dplyr)      ## Will be used for pandas replacement

# Connect to the database
db <- src_sqlite('/users/ryankelly/data.db')
db
数据处理的两个最佳选择(除了R之外)是:
- 数据表
- dplyr
预览数据
# Wrapped in a function for display purposes
head_ <- function(x, n = 5) kable(head(x, n))

head_(data)
| Agency | CreatedDate | ClosedDate | ComplaintType | Descriptor | City |
|---|---|---|---|---|---|
| NYPD | 04/11/2015 02:13:04 AM | Noise – Street/Sidewalk | Loud Music/Party | BROOKLYN | |
| DFTA | 04/11/2015 02:12:05 AM | Senior Center Complaint | N/A | ELMHURST | |
| NYPD | 04/11/2015 02:11:46 AM | Noise – Commercial | Loud Music/Party | JAMAICA | |
| NYPD | 04/11/2015 02:11:02 AM | Noise – Street/Sidewalk | Loud Talking | BROOKLYN | |
| NYPD | 04/11/2015 02:10:45 AM | Noise – Street/Sidewalk | Loud Music/Party | NEW YORK |
选择几列
| ComplaintType | Descriptor | Agency |
|---|---|---|
| Noise – Street/Sidewalk | Loud Music/Party | NYPD |
| Senior Center Complaint | N/A | DFTA |
| Noise – Commercial | Loud Music/Party | NYPD |
| Noise – Street/Sidewalk | Loud Talking | NYPD |
| Noise – Street/Sidewalk | Loud Music/Party | NYPD |
| Noise – Street/Sidewalk | Loud Talking | NYPD |
| Noise – Commercial | Loud Music/Party | NYPD |
| HPD Literature Request | The ABCs of Housing – Spanish | HPD |
| Noise – Street/Sidewalk | Loud Talking | NYPD |
| Street Condition | Plate Condition – Noisy | DOT |
使用WHERE过滤行
| ComplaintType | Descriptor | Agency |
|---|---|---|
| Noise – Street/Sidewalk | Loud Music/Party | NYPD |
| Noise – Commercial | Loud Music/Party | NYPD |
| Noise – Street/Sidewalk | Loud Talking | NYPD |
| Noise – Street/Sidewalk | Loud Music/Party | NYPD |
| Noise – Street/Sidewalk | Loud Talking | NYPD |
使用WHERE和IN过滤列中的多个值
| ComplaintType | Descriptor | Agency |
|---|---|---|
| Noise – Street/Sidewalk | Loud Music/Party | NYPD |
| Noise – Commercial | Loud Music/Party | NYPD |
| Noise – Street/Sidewalk | Loud Talking | NYPD |
| Noise – Street/Sidewalk | Loud Music/Party | NYPD |
| Noise – Street/Sidewalk | Loud Talking | NYPD |
在DISTINCT列中查找唯一值
##       City
## 1 BROOKLYN
## 2 ELMHURST
## 3  JAMAICA
## 4 NEW YORK
## 5
## 6  BAYSIDE
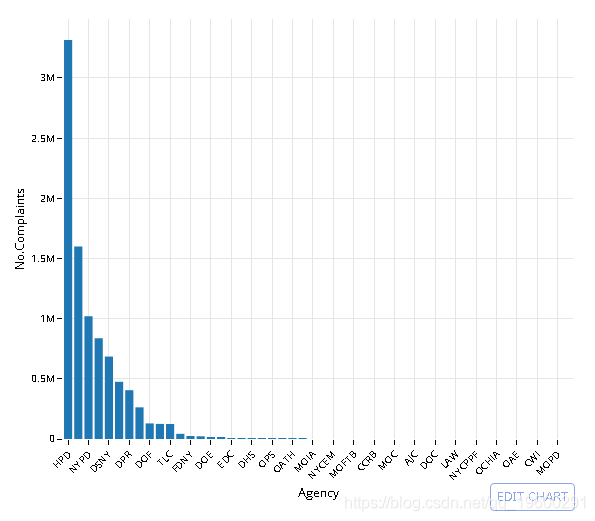
使用COUNT(*)和GROUP BY查询值计数
# dt[, .(No.Complaints = .N), Agency]
#setkey(dt, No.Complaints) # setkey index's the data

q <- data %>% select(Agency) %>% group_by(Agency) %>% summarise(No.Complaints = n())
head_(q)
| Agency | No.Complaints |
|---|---|
| 3-1-1 | 22499 |
| ACS | 3 |
| AJC | 7 |
| ART | 3 |
| CAU | 8 |
使用ORDER和-排序结果
交互版本:
静态版本:


数据库中有多少个城市?
# dt[, unique(City)]

q <- data %>% select(City) %>% distinct() %>% summarise(Number.of.Cities = n())
head(q)
##   Number.of.Cities
## 1             1818
让我们来绘制10个最受关注的城市
| City | No.Complaints |
|---|---|
| BROOKLYN | 2671085 |
| NEW YORK | 1692514 |
| BRONX | 1624292 |
| 766378 | |
| STATEN ISLAND | 437395 |
| JAMAICA | 147133 |
| FLUSHING | 117669 |
| ASTORIA | 90570 |
| Jamaica | 67083 |
| RIDGEWOOD | 66411 |
- 用
UPPER转换CITY格式。
| CITY | No.Complaints |
|---|---|
| BROOKLYN | 2671085 |
| NEW YORK | 1692514 |
| BRONX | 1624292 |
| 766378 | |
| STATEN ISLAND | 437395 |
| JAMAICA | 147133 |
| FLUSHING | 117669 |
| ASTORIA | 90570 |
| JAMAICA | 67083 |
| RIDGEWOOD | 66411 |
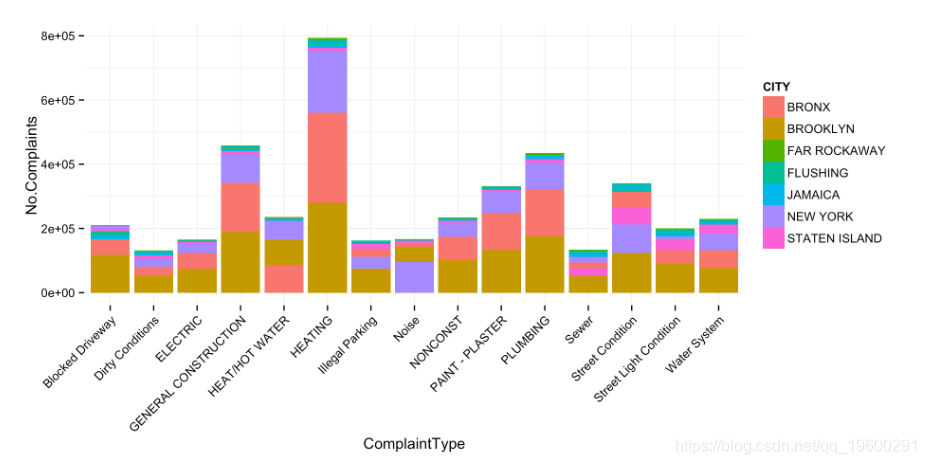
投诉类型(按城市)
# Plot result
plt <- ggplot(q_f, aes(ComplaintType, No.Complaints, fill = CITY)) +
            geom_bar(stat = 'identity') +
            theme_minimal() + theme(axis.text.x = element_text(angle = 45, hjust = 1))

plt

第2部分时间序列运算
提供的数据不适合SQLite的标准日期格式。
在SQL数据库中创建一个新列,然后使用格式化的date语句重新插入数据 创建一个新表并将格式化日期插入原始列名。
使用时间戳字符串过滤SQLite行:YYYY-MM-DD hh:mm:ss
# dt[CreatedDate < '2014-11-26 23:47:00' & CreatedDate > '2014-09-16 23:45:00',
#      .(ComplaintType, CreatedDate, City)]

q <- data %>% filter(CreatedDate < "2014-11-26 23:47:00",   CreatedDate > "2014-09-16 23:45:00") %>%
    select(ComplaintType, CreatedDate, City)

head_(q)
| ComplaintType | CreatedDate | City |
|---|---|---|
| Noise – Street/Sidewalk | 2014-11-12 11:59:56 | BRONX |
| Taxi Complaint | 2014-11-12 11:59:40 | BROOKLYN |
| Noise – Commercial | 2014-11-12 11:58:53 | BROOKLYN |
| Noise – Commercial | 2014-11-12 11:58:26 | NEW YORK |
| Noise – Street/Sidewalk | 2014-11-12 11:58:14 | NEW YORK |
使用strftime从时间戳中拉出小时单位
# dt[, hour := strftime('%H', CreatedDate), .(ComplaintType, CreatedDate, City)]

q <- data %>% mutate(hour = strftime('%H', CreatedDate)) %>%
            select(ComplaintType, CreatedDate, City, hour)

head_(q)
| ComplaintType | CreatedDate | City | hour |
|---|---|---|---|
| Noise – Street/Sidewalk | 2015-11-04 02:13:04 | BROOKLYN | 02 |
| Senior Center Complaint | 2015-11-04 02:12:05 | ELMHURST | 02 |
| Noise – Commercial | 2015-11-04 02:11:46 | JAMAICA | 02 |
| Noise – Street/Sidewalk | 2015-11-04 02:11:02 | BROOKLYN | 02 |
| Noise – Street/Sidewalk | 2015-11-04 02:10:45 | NEW YORK | 02 |
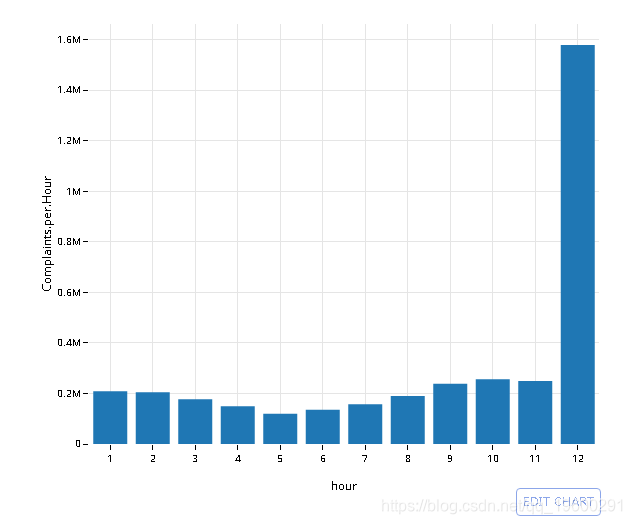


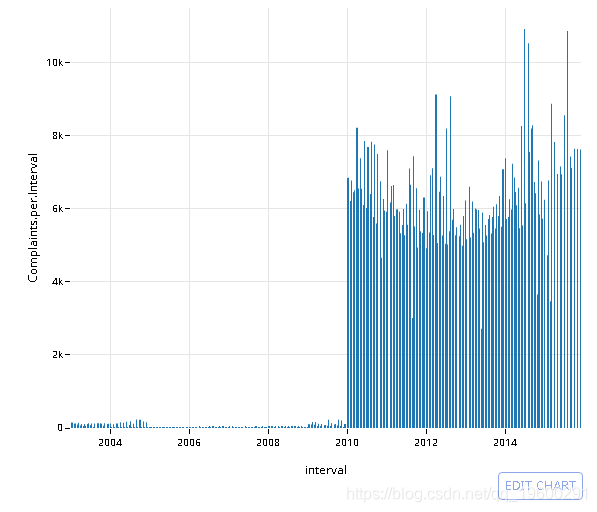
汇总时间序列
首先,创建一个时间戳记四舍五入到前15分钟间隔的新列
# Using lubridate::new_period()
# dt[, interval := CreatedDate - new_period(900, 'seconds')][, .(CreatedDate, interval)]

q <- data %>%
     mutate(interval = sql("datetime((strftime('%s', CreatedDate) / 900) * 900, 'unixepoch')")) %>%
     select(CreatedDate, interval)

head_(q, 10)
| CreatedDate | interval |
|---|---|
| 2015-11-04 02:13:04 | 2015-11-04 02:00:00 |
| 2015-11-04 02:12:05 | 2015-11-04 02:00:00 |
| 2015-11-04 02:11:46 | 2015-11-04 02:00:00 |
| 2015-11-04 02:11:02 | 2015-11-04 02:00:00 |
| 2015-11-04 02:10:45 | 2015-11-04 02:00:00 |
| 2015-11-04 02:09:07 | 2015-11-04 02:00:00 |
| 2015-11-04 02:05:47 | 2015-11-04 02:00:00 |
| 2015-11-04 02:03:43 | 2015-11-04 02:00:00 |
| 2015-11-04 02:03:29 | 2015-11-04 02:00:00 |
| 2015-11-04 02:02:17 | 2015-11-04 02:00:00 |
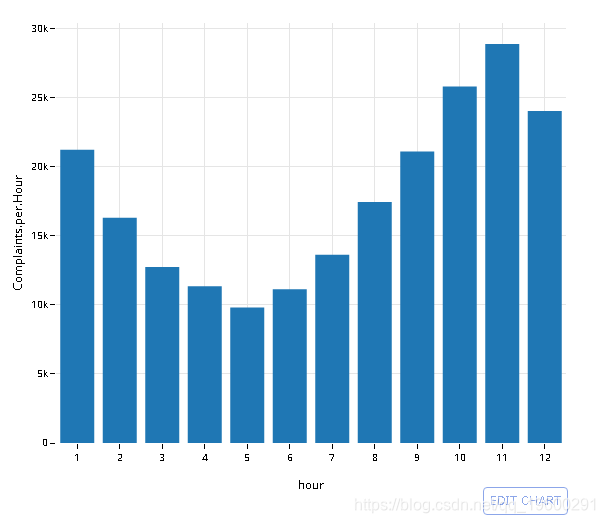
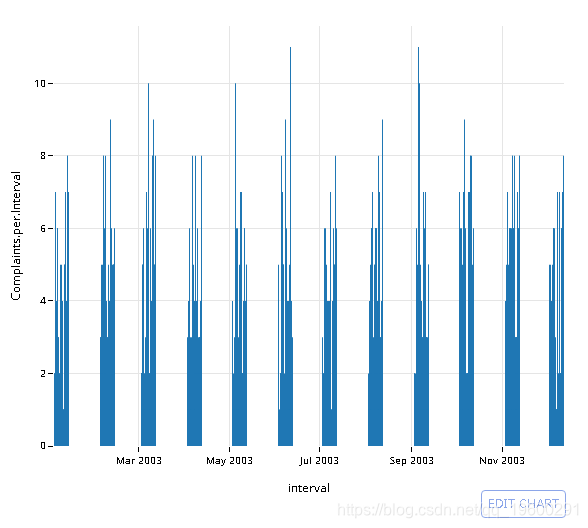
绘制2003年的结果


 R语言神经网络模型金融应用预测上证指数时间序列可视化
 数据分享|Eviews用ARIMA、指数曲线趋势模型对中国进出口总额时间序列预测分析
 python、R语言ARIMA-GARCH分析南方恒生中国企业ETF基金净值时间序列分析
 Python自激励阈值自回归(SETAR)、ARMA、BDS检验、预测分析太阳黑子时间序列数据


