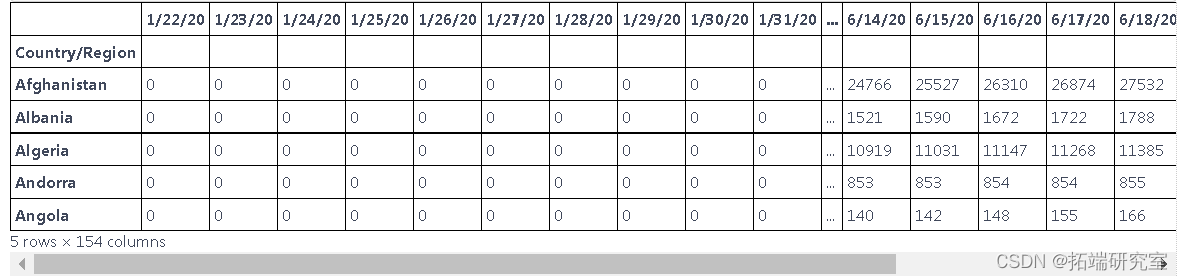
该数据根据世界各国提供的新病例数据。
获取时间序列数据
df=pd.read_csv("C://global.csv")
探索数据
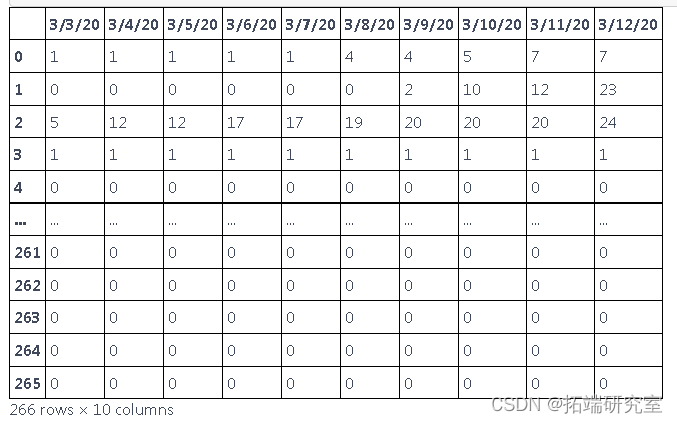
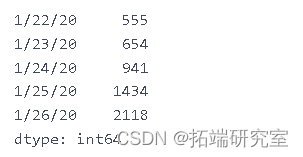
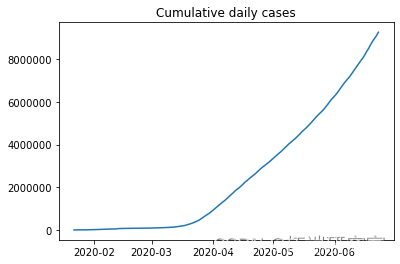
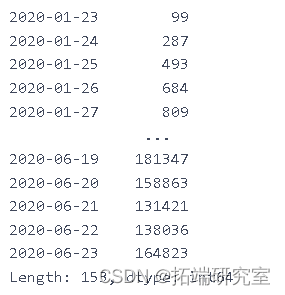
此表中的数据以累积的形式呈现,为了找出每天的新病例,我们需要减去这些值
可下载资源
GRU也是也可处理序列数据的一种模型,是循环神经网络的一种,同时呢它也是LSTM的一种变体,然后为什么要学习它,是因为我们了解了LSTM后发现他有很多可以精简改进的地方,例如说它复杂的模型结构,因此GRU就诞生了。相比较LSTM内部结构进行了简化,同时准确率也得到了提升。
为什么说GPU比LSTM更加的精简?
首先我们知道LSTM总共有三个门,遗忘门,输入门,输出门,而我们的GRU中呢使用的是两个门,重置门和更新门。
GRU和LSTM的区别:
LSTM有三个门,而GRU有两个门
去掉了细胞单元C
输出的时候取消了二阶的非线性函数
两个门的理解:
重置门:
作用对象是前边的隐藏状态
作用呢就是决定了有多少过去信息需要遗忘
更新门:(可以理解为LSTM中的遗忘门和输入门相结合)
作用对象是当前时刻和上一时刻的隐藏单元
作用就是上一时刻,以及当前时刻总共有多少有用的信息需要接着向下传递
df.head(10)
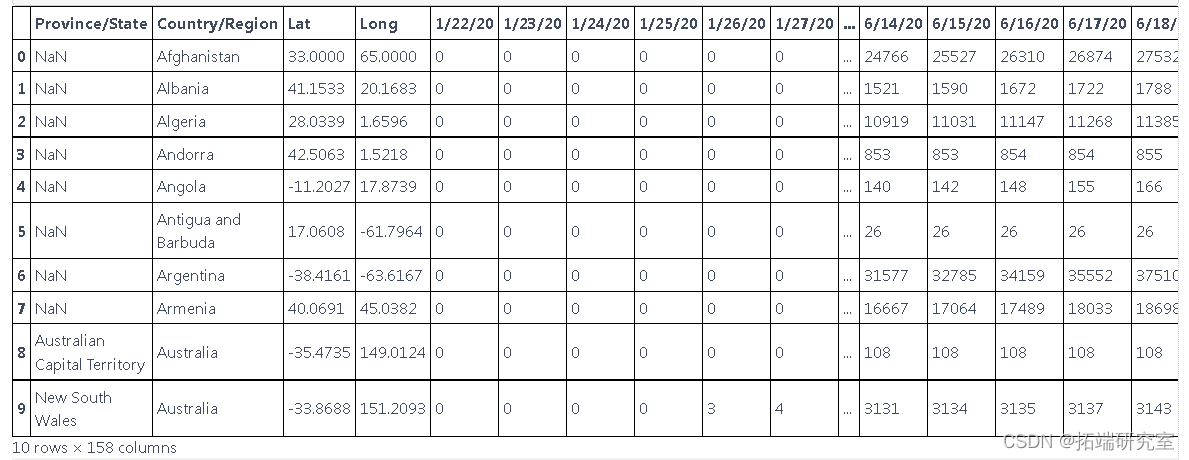
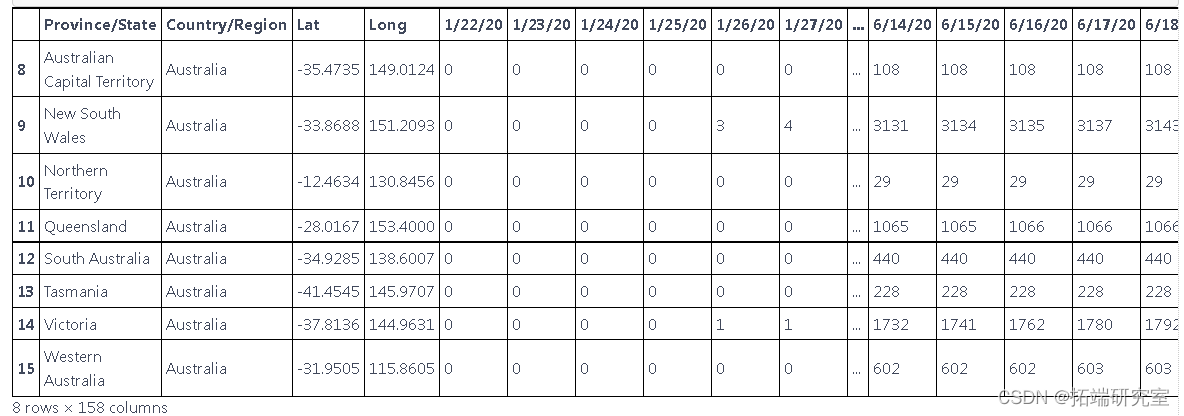
这些数据是根据国家和地区报告新病例的数据,但我们只想预测国家的新病例,因此我们使用 groupby 根据国家对它们进行分组
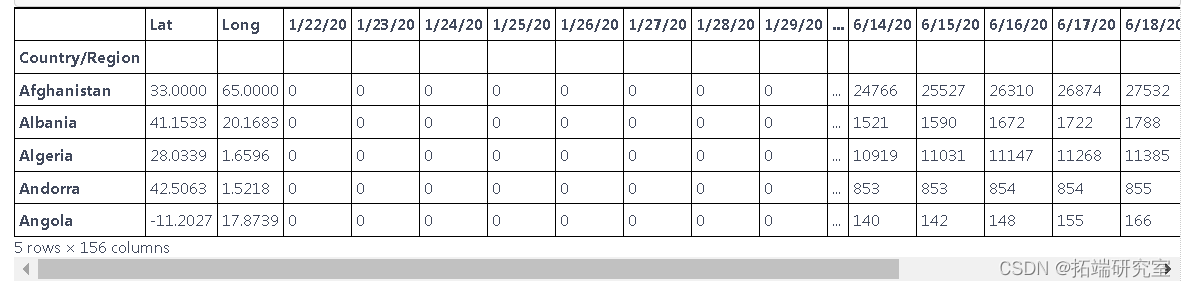
总结数据
执行 groupby 以根据一个国家的新病例来汇总数据,而不是根据地区
d1=df.groupby(\['Country/Region'\]).sum()

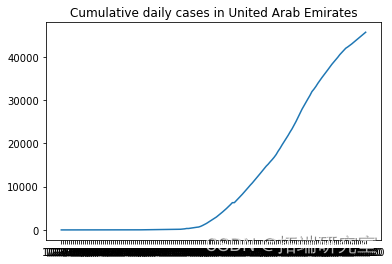
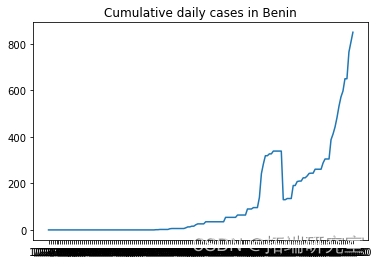
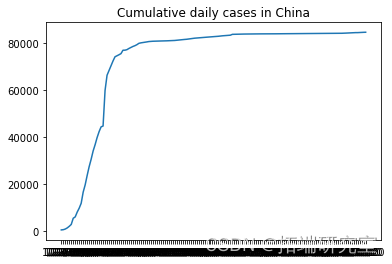
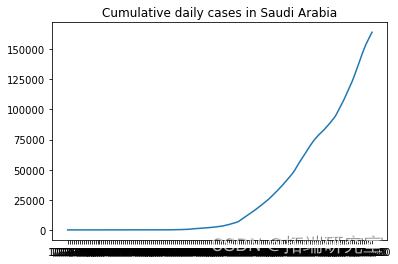
描述随机选择的国家的累计新病例增长
from numpy.random import seed


    plt.plot(F\[i\], label = RD\[i\])

    plt.show()
# 我们不需要前两列

d1=d1.iloc\[:,2:\]

# # 检查是否有空值


d1.isnull().sum().any()
我们可以对每个国家进行预测,也可以对所有国家进行预测,这次我们对所有国家进行预测
随时关注您喜欢的主题
dlycnmdcas.head()
dalycnfreces.index
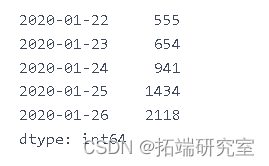
dal\_cnre\_ces.index = pd.to\_datetime(dailyonfrmd\_as.index)

plt.plot(dalnimedases)
ne\_ces = daiy\_onme_as.diff().dropna().astype(np.int64)

newcaes

plt.plot(ne_s\[1:\])
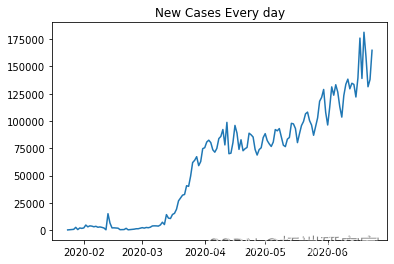
nw_s.shape
(153,)
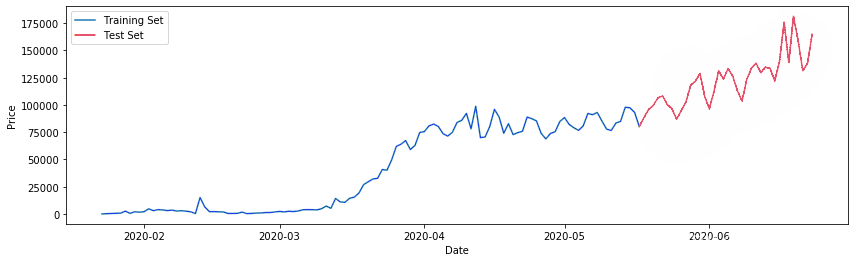
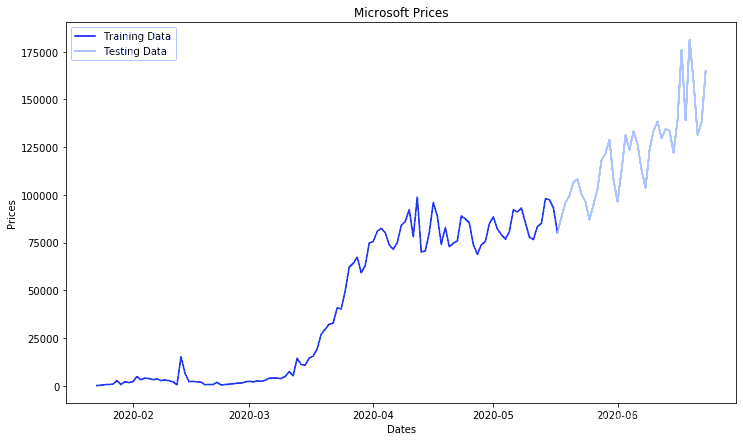
将数据拆分为训练和测试数据
ct=0.75

trin\_aa,tet\_aa = train\_test\_split(ne_ces, pct)
(116,)
``````
plt.plot(tainta)

plt.plot(tesata)
数据标准化
scaler = MinMaxScaler()
testa.shape
(38, 1)
创建序列
lentTe = len(ts_data)

for i in range(timmp, lenhTe):

    X\_st.append(tst\_aa\[i-tmStap:i\])

    y_tt.append(tesata\[i\])


X\_tet=np.array(X\_ts)

ytes=np.array(y_tt)
X_st.shape


Xtrn.shape

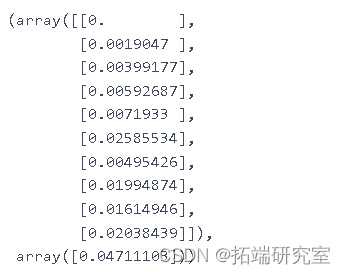
#  序列的样本

X_trn\[0\], yran\[0\]
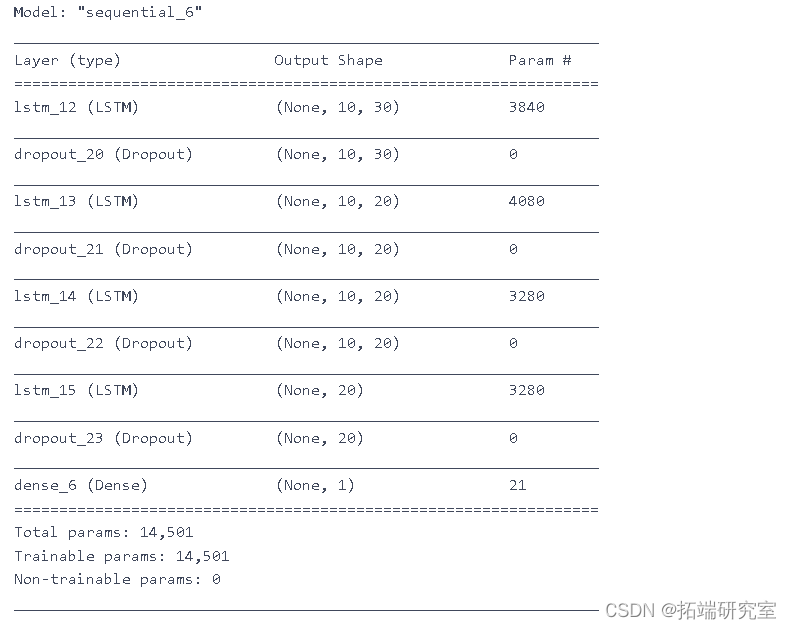
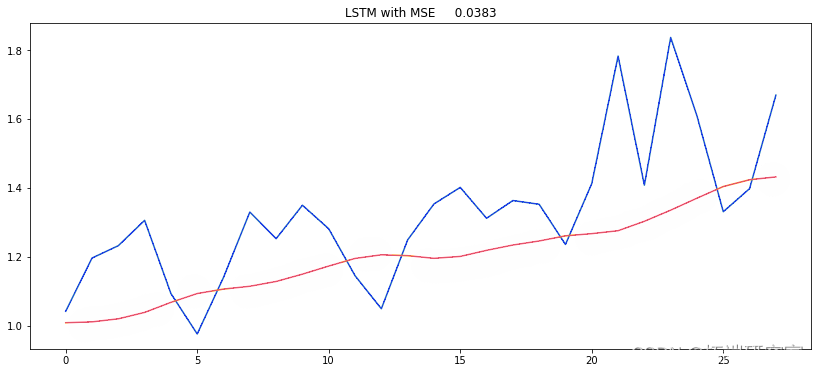
为股票价格预测设计 RNN 模型
模型:
- LSTM
- GRU
model.summary()
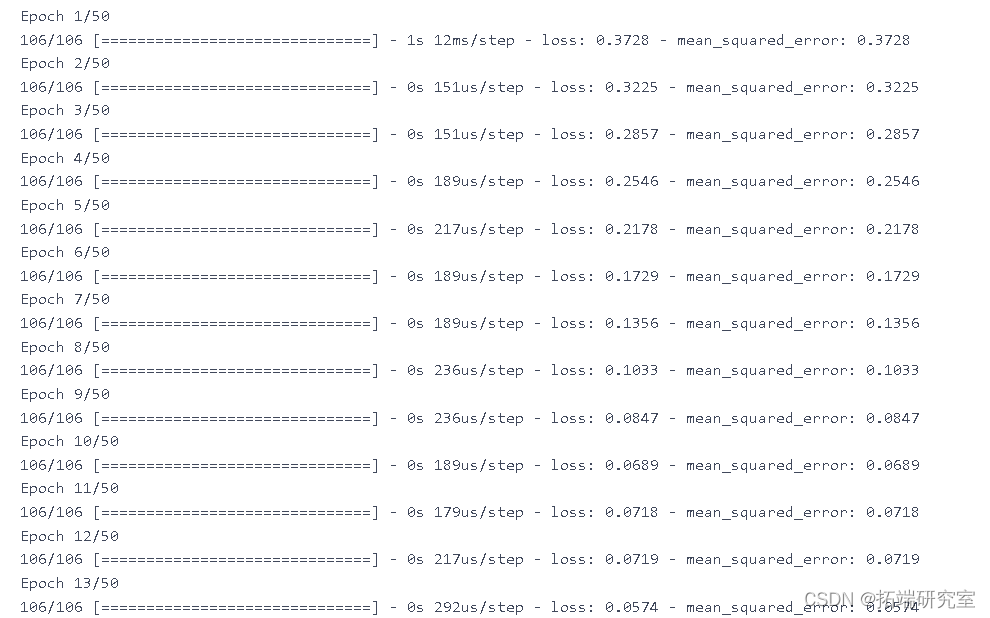
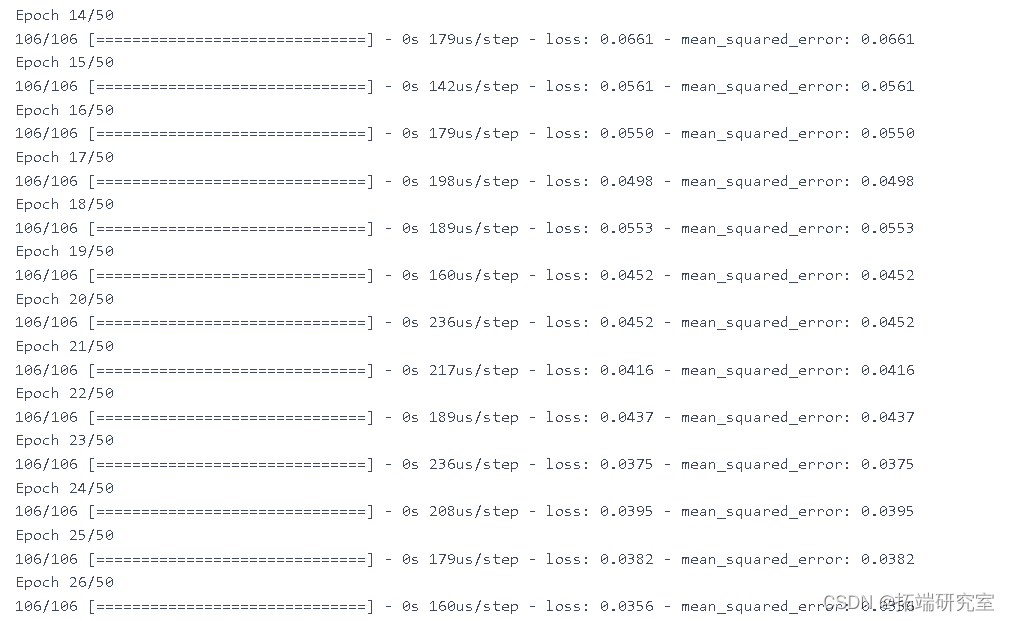
model.fit(X\_trn y\_rin, epochs=50, batch_size=200)
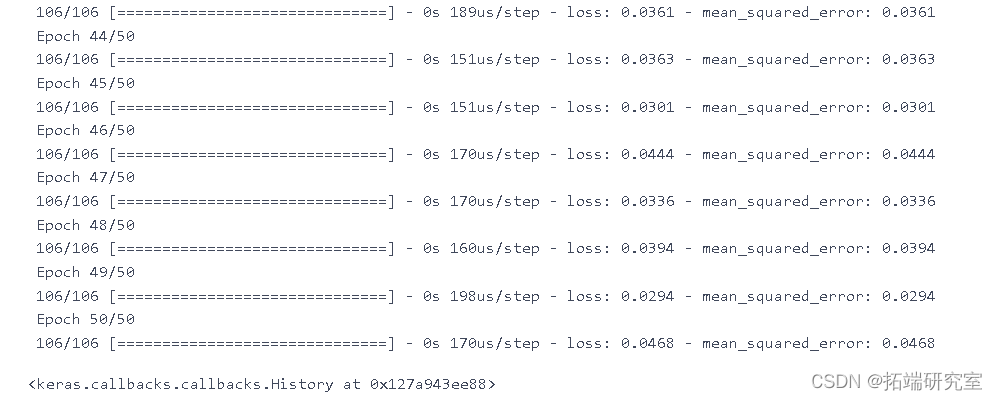
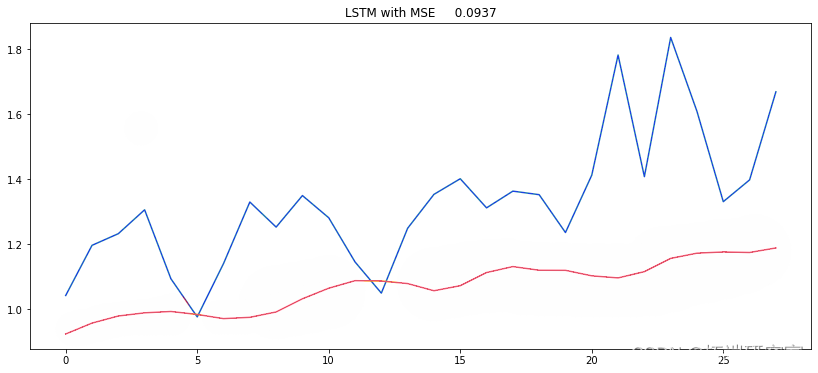
yprd = (mod.predict(X_test))

MSE = mean\_squared\_error(ytue, y_rd)


plt.figure(figsize=(14,6))
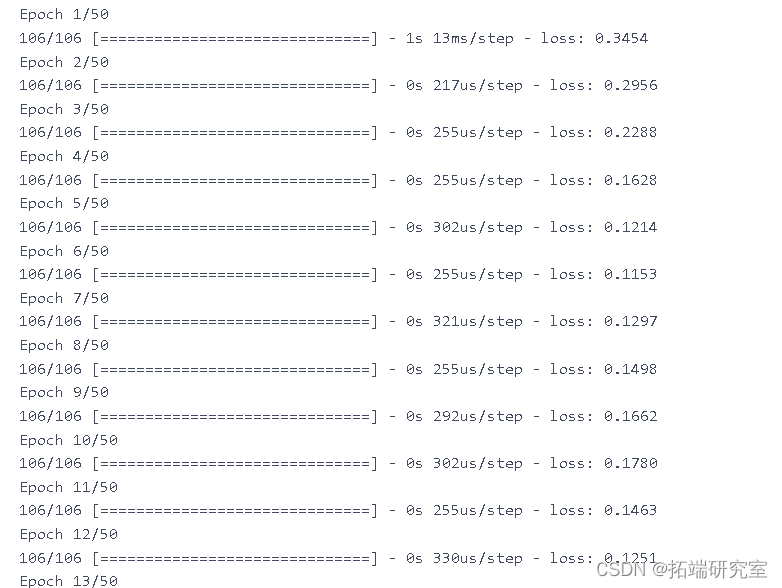
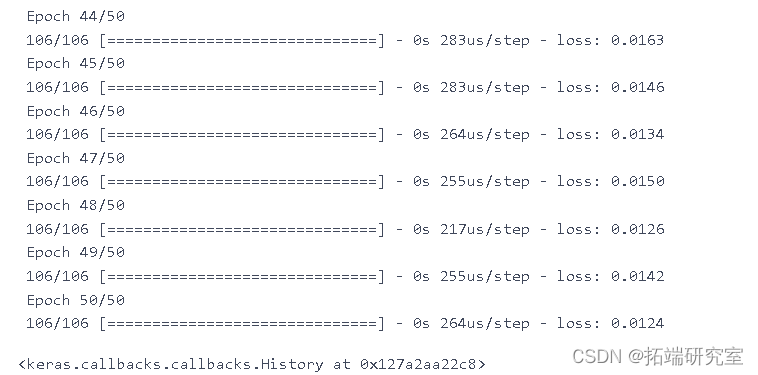
meRU= Sqtal(\[

                keras.layers.GRU(


model\_GRU.fit(Xtrn, ytin,epochs=50,batch\_size=150)
pe_rut = {}


y\_ue = (y\_et.reshape(-1,1))

y\_prd = (modlGU.predict(X\_test))

MSE = mean\_squared\_error(y_ue, ed)
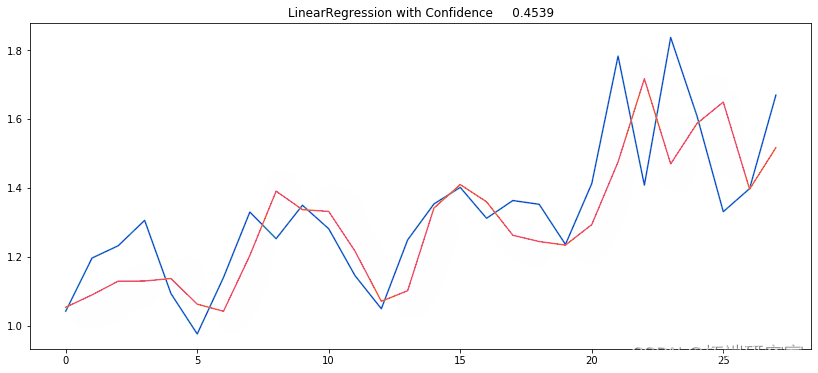
用于预测新病例的机器学习算法
准备数据
d__in.shape

moel=LinearRegression(nos=-2)
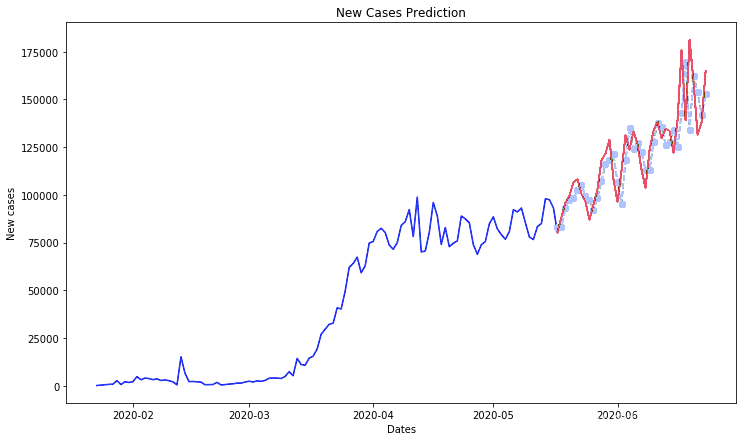
ARIMA
COVID-19 新病例预测的自回归综合移动平均线
#我们不需要前两列

df1.head()

daly\_nfrd\_cses = df1.sum(axis=0)

day\_cnir\_ase.index = pd.to\_datetime(da\_onieses.index)
new_cs = dacofmecss.diff().dropna().astype(np.int64)


tri\_ta,tet\_ata = trintt\_it(nw\_es, pct)
ero = men\_squred\_eror(ts_ar, pricos)


plt.figure(figsize=(12,7))

plt.plot(tanat)
 R语言Stan贝叶斯回归置信区间后验分布可视化模型检验
 R语言分类回归分析考研热现象分析与考研意愿价值变现
 R语言神经网络与决策树的银行顾客信用评估模型对比可视化研究
 R语言神经网络模型金融应用预测上证指数时间序列可视化


